
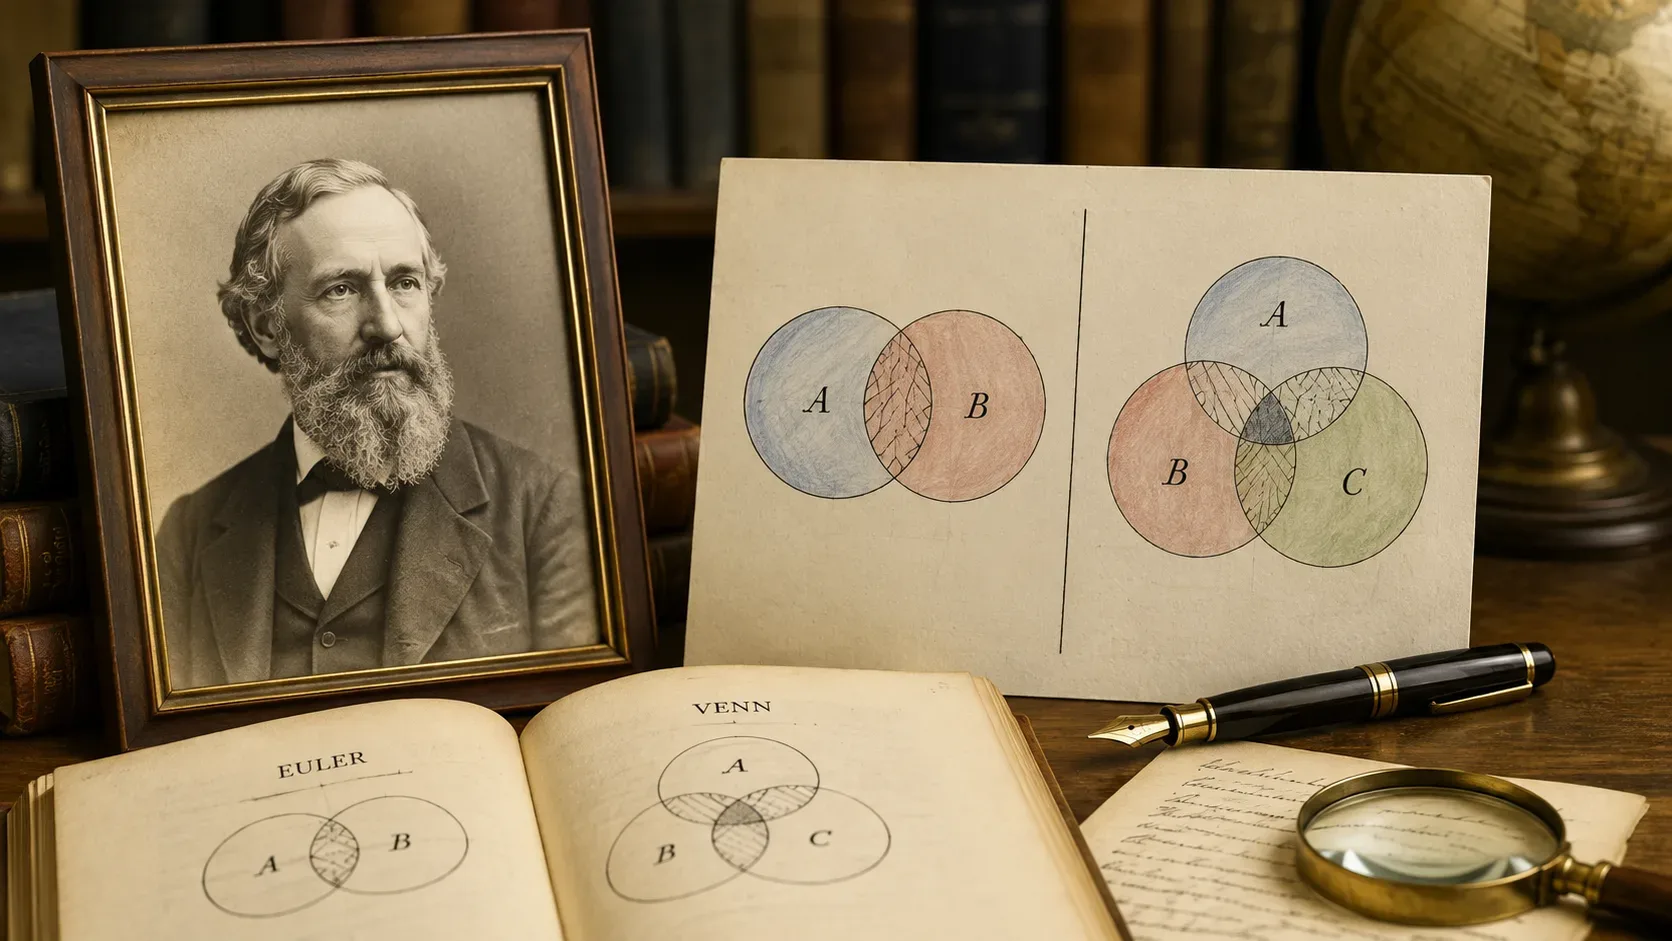
The circles we learn about in school tell only part of John Venn's story. Born on August 4, 1834, he became associated with one of the most recognizable representations of mathematics, but his career also spanned logic, probability theory, the Anglican priesthood and extensive work preserving the history of Cambridge University.
On August 4, 2026, it will be 192 years since his birth. The date offers an opportunity to answer not only who was John Venn, but also what was really new about his diagrams and why not every drawing with overlapping circles should be named after him.
Who was John Venn before the diagram
John Venn was born in Hull, England, into a family deeply linked to the evangelicalism of the Church of England. His father, Henry Venn, was a clergyman and held a prominent position in the Church Missionary Society. His grandfather, also called John Venn, had been a member of the so-called Clapham Sect, an Anglican group known for campaigns such as opposing the slave trade and defending social reforms. In this environment, young John was expected to follow the family's religious tradition.
He entered Gonville and Caius College, Cambridge University, in October 1853. He graduated in mathematics in 1857 as a sixth wrangler, a classification that indicated the sixth best result among students with first-class performance in the demanding Mathematical Tripos. Soon after, he became a fellow of Caius.
The religious trajectory occurred in parallel. Venn was ordained a deacon in the Diocese of Ely in 1858 and a priest in the Church of England in 1859. He worked as a curate in Cheshunt in the county of Hertfordshire and then in Mortlake, now part of London. Therefore, describing him as an Anglican clergyman or priest is more accurate than simply calling him “priest”, a word that, in Portuguese, is usually associated with Catholicism.
In 1862, Venn returned to Cambridge to teach Moral Sciences, an area that brought together studies of logic, philosophy, political economy and themes that today would be distributed among different departments. It was in this environment that he deepened his contact with the works of George Boole, Augustus De Morgan and John Stuart Mill.
The contribution that came before the circles
Venn's first major book was not about diagrams. Published in 1866, The Logic of Chance discussed the foundations of probability and its applications to the moral and social sciences. The work is associated with the systematic formulation of a frequentist interpretation: instead of understanding probability only as a degree of individual belief, Venn sought to relate it to the frequency observed in series of events.
This concern helps to understand your intellectual project. Venn was looking for methods capable of organizing reasoning about real phenomena, classes and regularities, without reducing logic to a purely verbal game. In 1881, he published Symbolic Logic, a work in which he developed his approach to algebraic logic influenced by Boole. In 1889, he released The Principles of Empirical or Inductive Logic.
Diagrams, therefore, did not appear as a graphic hobby. They were part of a broader attempt to transform abstract logical relations into a visual system that could be manipulated with rules.
Venn did not invent the idea of representing sets with circles
Visual representations of classes and logical relationships existed long before John Venn. In the 18th century, Leonhard Euler already used circles to express relationships such as inclusion, separation and overlap between categories. Other authors have also experimented with lines, squares, and different spatial arrangements to represent arguments.
Venn's contribution was not, therefore, to “invent all set design” nor to be the first to place circles on a page. His advance consisted of creating a system that started from all logically possible combinations between the analyzed classes and, only then, marked which regions should be considered empty or occupied.
Venn presented his proposal in works published in 1880 and developed it in Symbolic Logic, from 1881. Recent historical research shows that he applied principles of Boolean algebra to a problem that Euler diagrams did not solve satisfactorily: representing incomplete information without assuming relationships that had not been demonstrated.
Venn diagram and Euler diagram are not the same thing
The difference becomes clearer with a simple example.
Consider two classes:
- A: mathematics students;
- B: music students.
In an Euler diagram, the position of the circles already communicates the known relationship. If all math students also study music, circle A may appear entirely within circle B. If no one belongs to the two groups, the circles remain separate.
The Venn diagram starts the other way. Draw two overlapping circles to create all the possibilities:
- mathematics students only;
- music students only;
- students from both areas;
- people who do not belong to either group.
The initial design does not state that all of these regions contain people. It works like a grid of possibilities. Empty regions can then be shaded, and existing elements can be marked according to the available information. The central difference is that the Euler diagram seeks to show the relationship that is known to exist, while the Venn system first preserves all possible relationships.
| Feature | Euler diagram | Venn Diagram |
|---|---|---|
| Starting point | Effectively described relationships | All logically possible combinations |
| Regions without elements | Can be omitted | Remain available and can be marked as empty |
| Inclusion of one set in another | Usually shown by an outline within an outline | Shown by markings or shading of incompatible regions |
| More intuitive use | Known hierarchies, inclusions and exclusions | Systematic logical analysis and partial information |
| Main advantage | Visual clarity and economy | Avoid undue conclusions about relationships that are still unknown |
This distinction also explains why many current memes and infographics are technically Euler diagrams — or just illustrations with circles — and not Venn diagrams in the logical sense developed by Venn. Gonville and Caius College themselves note that many contemporary uses do not follow the structure of their system.
Why Venn circles work so well
The success of the diagrams has a functional explanation. A closed line immediately creates two understandable conditions: being in or being out. When two lines intersect, a third visual idea emerges: belonging simultaneously to two classes.
With three sets, the plane is divided into eight regions, corresponding to the eight possible combinations of membership. An element can be:
- outside the three sets;
- only in A;
- only in B;
- only in C;
- in A and B, but not in C;
- in A and C, but not in B;
- in B and C, but not in A;
- in the three sets.
This growth follows a simple rule: with n sets, there are 2ⁿ possible combinations of membership. Two sets produce four regions; three produce eight; four require 16.
The system makes abstract relationships visible and allows you to work on an already prepared structure. Unlike certain Euler representations, it is not necessary to redraw everything every time new information is added. The primary diagram remains, while shading and symbols record the premises.
It is reasonable to infer that this combination of regularity, reuse, and spatial reading helped diagrams cross the boundaries of formal logic and make their way into school textbooks, scientific research, presentations, and everyday comparisons. Circles, however, are an especially convenient convention for two or three sets, not a universal requirement. More complex Venn diagrams may employ ellipses or other closed curves.
The moment when circles oversimplify
The clarity of a diagram can also create an illusion: that every problem involving groups can be solved with overlaps.
Imagine a hypothetical survey of subscribers to a digital library. It separates readers into three sets:
- people who read science;
- people who read history;
- people who read mathematics.
A three-circle diagram quickly shows who belongs to more than one group. But it leaves out a lot of important information:
- how often each person reads;
- how many books were read;
- how interest has changed over time;
- if one category influenced the choice of another;
- if the drawn areas are proportional to the number of readers;
- which combinations are most relevant for an editorial decision.
The problem increases when the circles have sizes or intersections that appear quantitative. The reader tends to interpret a larger region as a larger group, even when the drawing was made simply to show logical relationships.
A study published in the journal PLOS ONE analyzed diagrams of three sets and showed that circles have geometric limitations to accurately represent all proportional areas. For two classes, it is possible to adjust two circles to different amounts; with three, the degrees of freedom may be insufficient to simultaneously reproduce all sizes and intersections. The authors even found scientific examples in which visually larger areas represented smaller numbers.
When there are many sets, another problem arises: the number of combinations grows exponentially. Five sets already produce 32 possible regions; six, 64. Even if the drawing is mathematically valid, it may be difficult to read.
In these cases, a table, bar chart, or visualization like UpSet, which organizes intersections in a matrix and allows you to order them by size, can communicate the data more accurately. UpSet was developed precisely to quantitatively analyze intersections and face scale problems that traditional diagrams do not solve well.
There is still a conceptual limit: overlap does not mean causality. A circle with “remote work” and another with “high productivity” may show that some people belong to both groups, but it does not demonstrate that remote work caused the productivity. The drawing registers belonging, not intensity, temporal sequence, mechanism or cause.
From priesthood to archival review
In 1883, Venn was elected a Fellow of the Royal Society and received a Doctor of Science degree from Cambridge. In the same year, he formally renounced religious orders, using a then-recent legal possibility. The decision reflected his distancing himself from the doctrinal positions of the Church of England, although biographical sources indicate that he retained religious convictions.
His career then began to dedicate increasing space to institutional history. Venn researched university archives, records and ecclesiastical documents to reconstruct the history of Cambridge members.
Between 1897 and 1901, he published the three volumes of The Biographical History of Gonville and Caius College, 1349–1897. He also wrote about John Caius, his own clerical family, and university life in the early centuries of Cambridge. In 1903, he was elected president of Gonville and Caius College.
His most ambitious project was Alumni Cantabrigienses, a biographical repertoire of students, graduates and office holders at the University of Cambridge. Venn worked on the work with his son, John Archibald Venn. The first volumes began to be published in 1922, and the project would be continued after his death. The digital alumni database maintained by Cambridge still recognizes the work of the two Venns as one of its main documentary foundations.
A chronology beyond the diagram
| Year | Event |
| 1834 | Born on August 4, in Hull, England |
| 1853 | Enters Gonville and Caius College, Cambridge |
| 1857 | He graduated in mathematics and became a fellow of Caius |
| 1858 | Ordained deacon |
| 1859 | Ordained Anglican priest |
| 1862 | Returns to Cambridge to teach Moral Sciences |
| 1866 | Publishes The Logic of Chance |
| 1880 | Publish your logic diagrams |
| 1881 | Publishes Symbolic Logic |
| 1883 | Joins the Royal Society and renounces religious orders |
| 1889 | Publishes The Principles of Empirical or Inductive Logic |
| 1897–1901 | Publishes the biographical story of Gonville and Caius College |
| 1903 | Becomes president of Caius |
| 1922 | Publication of Alumni Cantabrigienses | begins
| 1923 | Dies in Cambridge, on April 4 |
Chronology based on biographical, institutional and bibliographical records consulted.
John Venn's legacy is in the way he organized possibilities
John Venn died in Cambridge on April 4, 1923. His name remained linked to circles, but his most profound contribution lies not just in geometric form.
The Venn system teaches us to separate what we know from what only seems possible. Before filling in a diagram, it forces reasoning to reserve space for each combination. Only then does the evidence eliminate or confirm regions.
This intellectual discipline unites several parts of his life: the logician interested in the structure of arguments, the probability researcher attentive to series of events and the historian who organized thousands of records without transforming documentary gaps into certainties.
Circles won because they are simple. Venn's work remains relevant because it shows that simplicity does not have to mean simplistic reasoning.
To follow other stories of scientists, mathematicians and thinkers, subscribe to updates and explore DBIO's biography series.