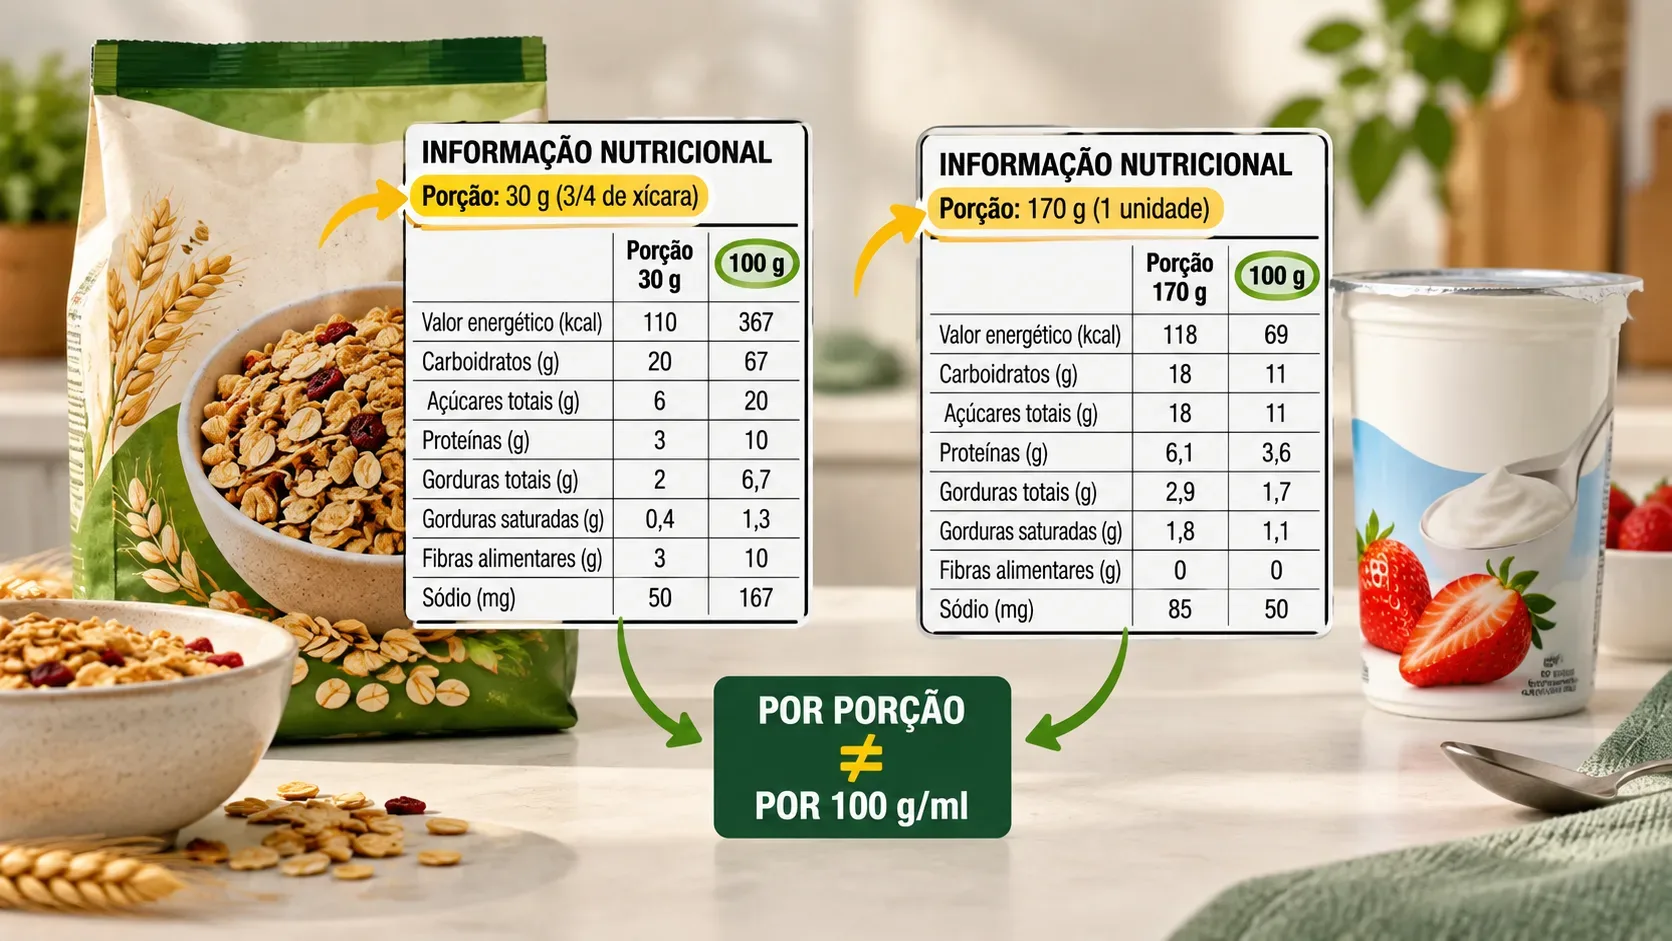
To compare two foods whose declared serving sizes are different, the 100 g or 100 ml column is the fairest common basis: it puts the products on the same reference amount. The serving column answers a different question, namely how much energy and nutrients are present in the amount declared on that product's label. Both are useful, but for different tasks.
Brazil's health regulator Anvisa added the declaration per 100 g or 100 ml specifically to make product comparisons easier. The requirement is associated with RDC 429/2020 and IN 75/2020, which redesigned Brazil's nutrition facts table. In 2026, Anvisa was still referring to RDC 429/2020 as a rule in force and highlighting that the change expanded consumers' ability to compare foods.
Serving and 100 g/ml answer different questions
| Label information | Question it answers | Most useful use |
|---|---|---|
| Per 100 g or 100 ml | How much of the nutrient is present in the same standardized amount of product? | Compare two products with different serving sizes, especially when they are in the same category or serve a similar purpose. |
| Per serving | How much of the nutrient is present in the amount the manufacturer declares as one serving? | Estimate intake when the label serving is close to the amount you actually consume. |
| %DV | How much does the declared serving represent of daily reference values? | Put the serving into a daily dietary context. In Anvisa's table models, %DV is supplied by the serving. |
This means that 100 g is not a recommended amount to eat. It is a comparison basis. A person may eat 20 g, 60 g, or another amount depending on the food and the situation. To know what that amount actually provides, you need to return to the serving information or calculate it from the 100 g/ml column.
Example: different serving sizes can change the first impression
Imagine two fictional granolas. The numbers below are only a teaching example and do not correspond to real brands.
| Item | Product A | Product B |
|---|---|---|
| Declared serving | 30 g | 45 g |
| Energy per serving | 120 kcal | 165 kcal |
| Added sugars per serving | 4 g | 5 g |
| Protein per serving | 3 g | 6 g |
| Sodium per serving | 45 mg | 54 mg |
| Energy per 100 g | 400 kcal | 367 kcal |
| Added sugars per 100 g | 13.3 g | 11.1 g |
| Protein per 100 g | 10 g | 13.3 g |
| Sodium per 100 g | 150 mg | 120 mg |
If you look only at the serving column, Product A appears to have fewer calories, less added sugar, and less sodium. But A's serving is also smaller. When both products are put on the same 100 g basis, Product B has less energy, less added sugar, less sodium, and more protein in this example.
This does not mean Product B is always the better choice. The 100 g comparison shows the relative concentration of nutrients. A practical decision also depends on how much will be consumed, the overall diet, the ingredient list, and individual needs.
When to look at 100 g or 100 ml first
- When two products in the same category use different serving sizes.
- When you want to know which product has a higher or lower concentration of a specific nutrient.
- When the declared serving is very different from the amount you usually eat.
- When differences in serving size could make larger or smaller numbers look more favorable even though the products are not being compared on the same basis.
For solid foods, look for the per 100 g column. For liquids, look for the per 100 ml column. Do not treat 100 g of a solid and 100 ml of a liquid as physically equivalent amounts, because grams measure mass while milliliters measure volume.
When serving information matters most
The serving column takes priority when the question is: how much will I consume in the amount I will actually eat or drink? If the label declares 30 g and you usually eat about 30 g, the per-serving column already provides a direct estimate. If you eat twice that amount, a simple approximation is to double the values, while remembering that labels may apply rounding rules.
It is also worth checking the number of servings per package. A package may look like a single-serve item and still contain more than one declared serving. In that case, eating the whole package requires considering the total amount actually consumed, not just the numbers for one serving.
How to convert the 100 g column to the amount you eat
A practical calculation for solid foods is:
nutrient amount consumed = value per 100 g × grams consumed ÷ 100
For liquids, use the same reasoning with 100 ml. In the Product B example, sodium is 120 mg per 100 g. If someone eats 60 g, the estimate is 120 × 60 ÷ 100 = 72 mg of sodium. For added sugars, 11.1 g per 100 g would result in approximately 6.7 g in 60 g.
Using the printed 100 g/ml column is preferable to recalculating manually from the serving when the goal is to compare labels, because the table already provides the common basis and reduces the effect of rounding differences in serving values.
A comparison routine that takes less than a minute
- Choose the nutrient that actually matters for the comparison. It may be sodium, added sugars, protein, fiber, saturated fat, energy, or another item in the table.
- Put the products on the same basis. Compare the 100 g column between solids or the 100 ml column between liquids.
- Then return to the amount you plan to consume. A better concentration comparison does not eliminate the need to consider the actual serving.
- Use %DV as serving context. It helps show how much the declared serving contributes to daily reference values, but it does not replace the 100 g/ml basis when product serving sizes differ.
- Read the label as a whole. The nutrition facts table, ingredient list, and, when applicable, front-of-pack nutrition labeling answer complementary questions.
Common mistakes when placing two labels side by side
- Comparing only the serving column without checking serving sizes. This is the mistake most likely to create an uneven comparison.
- Treating 100 g or 100 ml as a recommended serving. The main function of that column is to standardize the comparison basis.
- Choosing a product from one isolated number. A food may have less sodium while also differing meaningfully in sugars, fats, fiber, protein, or ingredients.
- Ignoring how much will actually be consumed. A more concentrated product may be eaten in a small amount, while a less concentrated product may be eaten in a larger amount.
- Comparing foods that do not serve a similar role and drawing a broad conclusion. The 100 g/ml basis improves numerical comparison, but it does not make very different foods nutritionally equivalent.
What changed in Brazilian nutrition labeling
Anvisa states that the rules published in 2020 made it mandatory to declare energy and nutrient values per 100 g or 100 ml, in addition to per-serving information and the number of servings per package. The stated purpose of this standardized basis is to make product comparison easier. Official table models show the 100 g or 100 ml basis, the serving, and %DV side by side, with the note that the percentage of daily values is supplied by the serving.
In practice, the safest reading rule is simple: use 100 g/ml to compare concentration and use the serving, adjusted to what you actually consume, to estimate intake. That keeps differences in serving size from distorting a side-by-side label comparison.