Countries with similar GDP per capita can have different HDI values because average economic output and human development are not the same measure. GDP per capita divides economic output by population; the Human Development Index (HDI) also considers health and education outcomes. Similar average output therefore does not guarantee similar life expectancy or schooling.
There is another essential distinction: the income component of the HDI is gross national income (GNI) per capita adjusted for purchasing power parity (PPP), not GDP per capita. These indicators answer different questions and should be read together, without treating their difference as automatic proof of a cause or of the quality of a public policy. See the UNDP definitions and the World Bank's GDP per capita series.
What each indicator tells us
| Indicator | What it measures | What it cannot establish on its own |
|---|---|---|
| GDP per capita | Gross domestic product divided by population, for a specified currency unit and period. | How much each resident actually receives or how output and income are distributed. |
| HDI | A summary of average outcomes in longevity, education and standard of living. | All living conditions, inequalities within a country or the causes of observed outcomes. |
GDP per capita may be expressed, for example, in current US dollars or in PPP-adjusted values. Do not compare figures using different monetary bases as though they were equivalent. The World Bank's explanation of GDP and national income also distinguishes output produced within a territory from income received by its residents.
Which components make up the HDI
| Dimension | Indicator used by UNDP | What to examine |
|---|---|---|
| Health | Life expectancy at birth. | Expected average length of life under the observed mortality conditions. |
| Education | Mean years of schooling among people aged 25 and over, and expected years of schooling for children entering school. | Accumulated educational attainment and the expected schooling pathway. |
| Standard of living | GNI per capita in PPP terms. | Residents' average economic resources, adjusted for price differences across countries. |
UNDP normalizes the results for these three dimensions and calculates the geometric mean of their dimension indices. For income, it uses a logarithmic transformation, reducing the weight of successive monetary increases at higher levels. The HDI is therefore not a simple sum of GDP, years of schooling and life expectancy; see the official methodology.
Two hypothetical scenarios with similar income
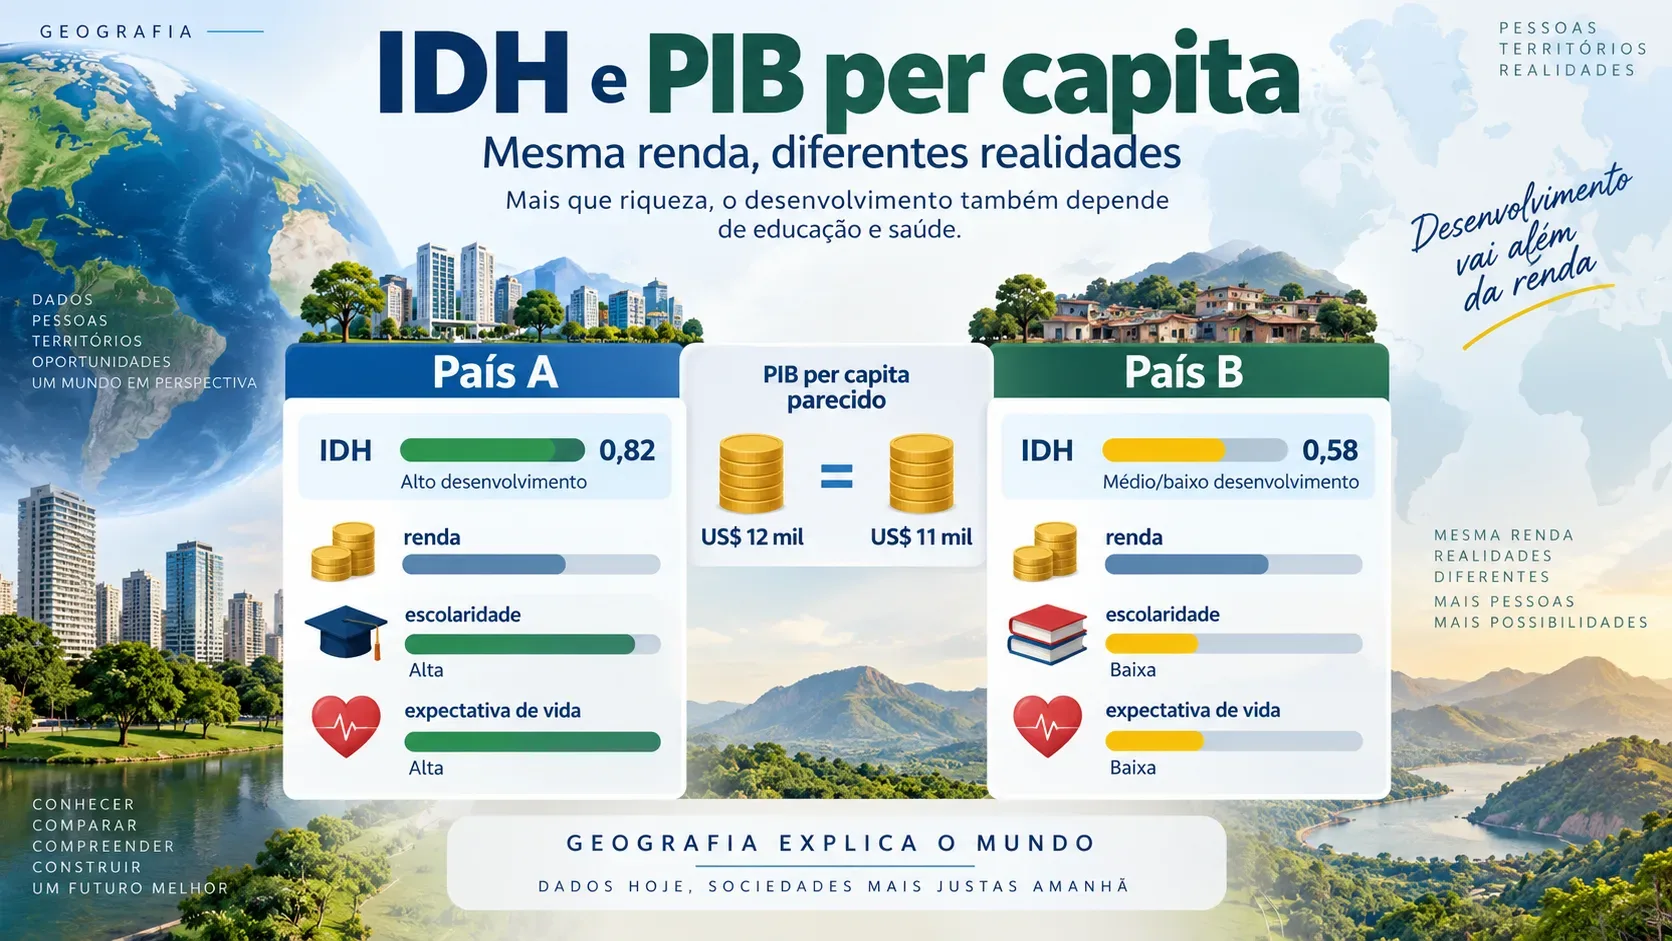
Imagine countries A and B below. Both are fictional: the GDP-per-capita figures are only teaching examples, while the social outcomes are qualitative comparisons, not official data or estimates.
| Aspect | Country A (hypothetical) | Country B (hypothetical) |
|---|---|---|
| GDP per capita in current US dollars | US$12,000 | US$11,000 |
| GNI per capita in PPP terms | Assume it is close to country B's. | Assume it is close to country A's. |
| Schooling | More years of schooling. | Fewer years of schooling. |
| Life expectancy | Higher. | Lower. |
| Possible HDI reading | Would tend to be higher, under these assumptions. | Would tend to be lower, under these assumptions. |
The scenario isolates the central question: even when national income per person is assumed to be comparable, differences in education and health change the composite index. The figures 0.82 and 0.58 shown on the cover are visual illustrations, not HDI values calculated from this table. A valid HDI would require the corresponding indicators and application of UNDP's methodology.
Why similar income can accompany different social outcomes
- Output is not distribution: dividing GDP by population produces an average, not the typical income of each household. The distribution of resources can vary.
- Income does not automatically mean access: schooling and longevity indicators record outcomes distinct from the value produced by an economy.
- GDP and GNI are not interchangeable: income flows between residents and the rest of the world can make national income differ from domestic output.
- Averages conceal differences: regions and groups within one country may experience different conditions even if the national indicator is the same.
These are mechanisms and possible interpretations, not diagnoses of particular countries. An observational comparison of indicators alone cannot show which decision or event caused a difference.
How to compare countries without mixing up measures
- Check the data's year, geographic coverage and source before comparing.
- Check whether GDP per capita is nominal, in constant prices or PPP-adjusted, and do not mix units.
- For the HDI, examine life expectancy, both schooling measures and GNI per capita in PPP terms separately.
- Do not replace GNI with GDP when calculating the HDI or interpret GDP per capita as an average wage.
- To explore inequalities within a country, complement the HDI with the inequality-adjusted HDI (IHDI) and other relevant data.
What the HDI does not show
According to UNDP, the HDI captures only part of human development: it does not directly incorporate, for example, poverty, inequality, human security, or participation and agency. A national figure can also conceal meaningful differences across social groups and regions.
UNDP's IHDI adjusts the HDI dimensions for inequality in their distribution. A careful reading therefore uses GDP per capita to situate average economic output, the HDI to bring together three basic human outcomes, and complementary data to investigate what each average leaves out. Neither number, on its own, fully describes a country's reality.