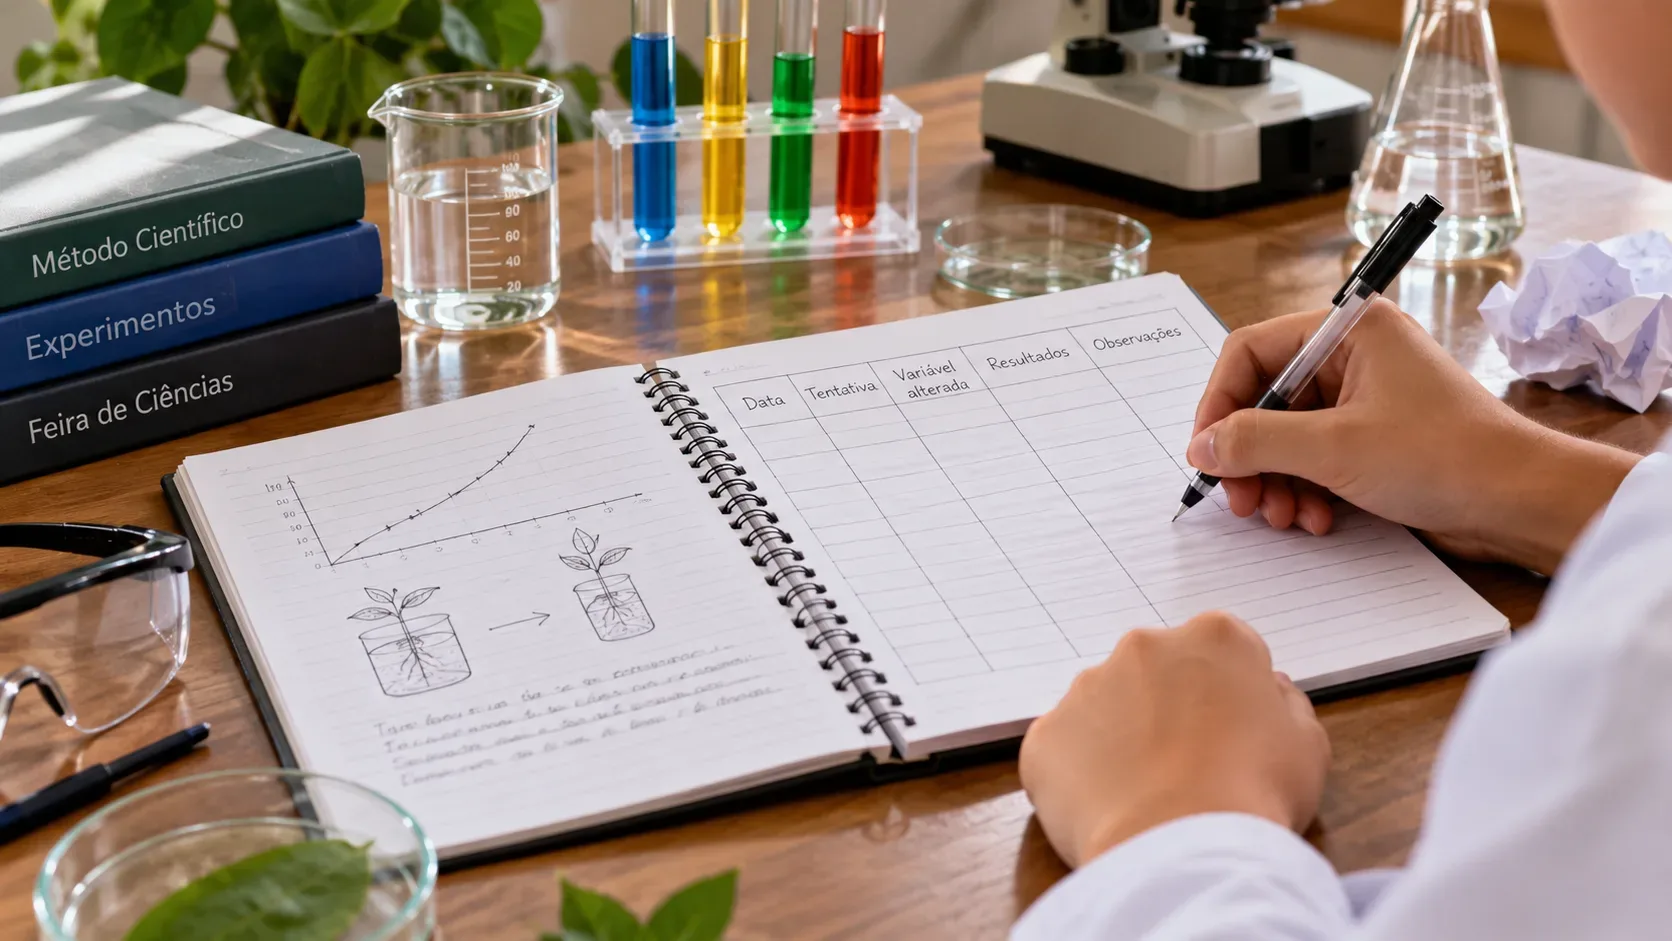
At a science fair, a lab notebook is not just an attendance record or a rough version of the final report. It should allow someone else to understand what was done in each trial, under which conditions, what changed, what was measured, and why the next round was different. When the record is consistent, the team can reconstruct the experiment, demonstrate real repetitions, and explain errors or adjustments without relying on memory.
Brazilian educational guidance on school research highlights the logbook as a detailed record of dates, stages, investigations, discoveries, and observations throughout a project. Experimentation guides also recommend recording data during the test, documenting procedure changes, and keeping controlled variables constant whenever possible. See, for example, the practice published on the Base Nacional Comum Curricular website and the guidance from Science Buddies.
What the notebook needs to demonstrate about the process
A simple test shows whether an entry is complete: a few days later, could you repeat the trial without relying on memory? To make that possible, the record should separate what was planned—hypothesis, variable, controls, and procedure—from what actually happened—measurements, deviations, problems, observations, and later decisions.
A real experiment rarely goes perfectly. A timer may be started late, a sample may spill, temperature may vary, or a method step may need adjustment. The value of the logbook lies in preserving that path, including what went wrong.
One-page trial model: 8 essential fields
A practical approach is to reserve a block or a page for each trial and always use the same field order. This makes repetitions comparable and shows clearly when a condition changed.
| Field | What to record | Role in the history |
|---|---|---|
| Date and code | Date, time, and an identifier such as T1, T2, or T3. | Creates the chronology and links notes, photos, and files to the correct round. |
| Hypothesis or objective | What is being tested in that trial and the expected result. | Shows why the round was performed. |
| Variable changed | Which independent variable changed and the value or condition used. | Identifies exactly what distinguishes that condition. |
| Controls | Factors that should remain the same, such as time, amount, container, temperature, or lighting. | Helps determine whether comparisons between trials are fair. |
| Actual procedure | Steps performed and any difference from the plan. | Prevents practical changes from being hidden behind an idealized method. |
| Measurements and raw data | Observed values, units, and the instrument used. | Preserves data before averages, graphs, and interpretation. |
| Anomalies and evidence | Failures, unexpected events, observations, sketches, photos, or file references. | Explains outlying results without erasing them. |
| Next decision | Repeat unchanged, correct an error, change a variable, or end the series, with a reason. | Records the logic connecting one trial to the next. |
Repetition is more than simply “doing it again”
A useful repetition tries to maintain the same experimental condition to see whether the result remains within a reasonable range of variation. The notebook should therefore show which trials belong to the same repetition set.
If T1, T2, and T3 use the same value of the independent variable, record the controls needed to check whether they are truly comparable. If the container changed in T3, the sample was exposed for longer, or the temperature was different, that needs to be recorded. Depending on the project, T3 may still be useful as exploratory data, but it should not be presented as an identical repeat without a note.
Science Buddies recommends repeating tests to check that a result was not accidental and notes that the appropriate number of repetitions depends on the experiment and project rules. Instead of treating “three trials” as a universal law, follow the teacher’s guidance, the science fair rules, and the nature of the measurement. See also the page on experimental procedures and repetitions.
How to record an error without erasing the history
Experimental error does not automatically mean “useless experiment.” It is better to identify the type of problem: a value written incorrectly, a step performed differently from the plan, or an unexpected result even though the procedure was followed.
In every case, preserve the original record and add the correction or note in a traceable way. Rewriting the notebook neatly to hide corrections, failed trials, or intermediate decisions is not good practice. Scientific documentation guidelines stress that changes should keep the previous record identifiable and explain why it was changed; a more formal example is available in the NCBI Bookshelf guidance on experimental records.
For a school project, a readable correction is enough: cross out the wrong value with one line that leaves it legible, write the correct value beside it, and note the reason. If the problem compromised the entire trial, mark it “not comparable” or “repeat” instead of simply deleting it.
Changed a variable? Start a new trial entry
When the purpose is to test an independent variable, its value should be clearly shown in each round. The same care applies to changes made to the method itself.
Imagine that the team is testing how the amount of light affects seedling growth. After two trials, the group notices poor drainage and decides to change the pot. The change may improve the experiment, but it also creates a new condition. The notebook should record what changed, starting with which trial, and why. This prevents results from before and after the change from being mixed as though they were directly equivalent.
A useful rule is: did something change that could affect the result? Start a new trial entry and describe the change before interpreting its effects.
Measurements, photos, and evidence: record before summarizing
Raw values should appear before averages and graphs. If three time measurements were taken, record all three. The average can be calculated later, but it should not replace the original values. Include the unit and instrument as well: “12” is ambiguous; “12.0 s on the phone stopwatch” is much more informative.
Photos can document the setup, material positions, visual changes, or unexpected events, but they need to be linked to the correct trial. A simple method is to use codes: T4_photo1, T4_photo2, and so on. In the notebook, record the code and a short description. School lab guides recommend photographing the process while still treating the notebook as the main place for data and observations.
Example trial record
| Field | Example |
|---|---|
| Date and code | 09/05/2026 — T4 — 2:20 p.m. |
| Objective | Repeat the 20 mL condition to check whether the reaction time remains close to T2 and T3. |
| Variable changed | Volume of solution A: 20 mL. |
| Controls | Same container; solution B = 10 mL; initial temperature = 24 °C; same mixing method. |
| Actual procedure | Followed as planned. Mixing started immediately after adding solution B. |
| Measurement | Time until the defined criterion: 18.4 s. |
| Anomaly/evidence | No spill; small bubble on the container wall. Photo: T4_photo1. |
| Decision | Repeat once more under the same condition before calculating the average. |
Checklist before the science fair
- Can you identify the date and order of every trial?
- Are repetitions under the same condition clearly grouped?
- Is the changed variable and its value shown in every round?
- Were the main controls and any deviations recorded?
- Are raw data shown with units before averages and graphs?
- Do failures, anomalies, and procedure changes remain visible?
- Do photos or files have codes linked to the corresponding trial?
- Is the decision to repeat, correct, or change a variable justified?
- Could another person reconstruct the experiment using the notebook and procedure?
A good logbook does not “prove” that the experiment was perfect. It does something more useful: it transparently shows how each result was obtained, which trials are comparable, and why the method changed during the project. That traceability strengthens a science fair presentation.