One bottle warming more than another can make a useful science-fair experiment, but it is not a faithful miniature of Earth’s atmosphere. A setup with two transparent containers can teach controlled comparison, temperature-curve recording, and the effect of reducing air exchange. The key precaution is not to interpret a temperature difference automatically as “proof” that greenhouse gases work like a lid.
In the real atmosphere, the essential mechanism is radiative: the warmed surface emits energy mainly as infrared radiation, and gases such as water vapor, carbon dioxide, and methane absorb and re-emit part of that radiation. NASA describes this energy balance; NOAA stresses that comparison with a glass greenhouse is an imperfect analogy because a physical greenhouse warms largely by restricting convection, while the atmospheric greenhouse effect depends on interactions with infrared radiation.
What the bottle experiment can show
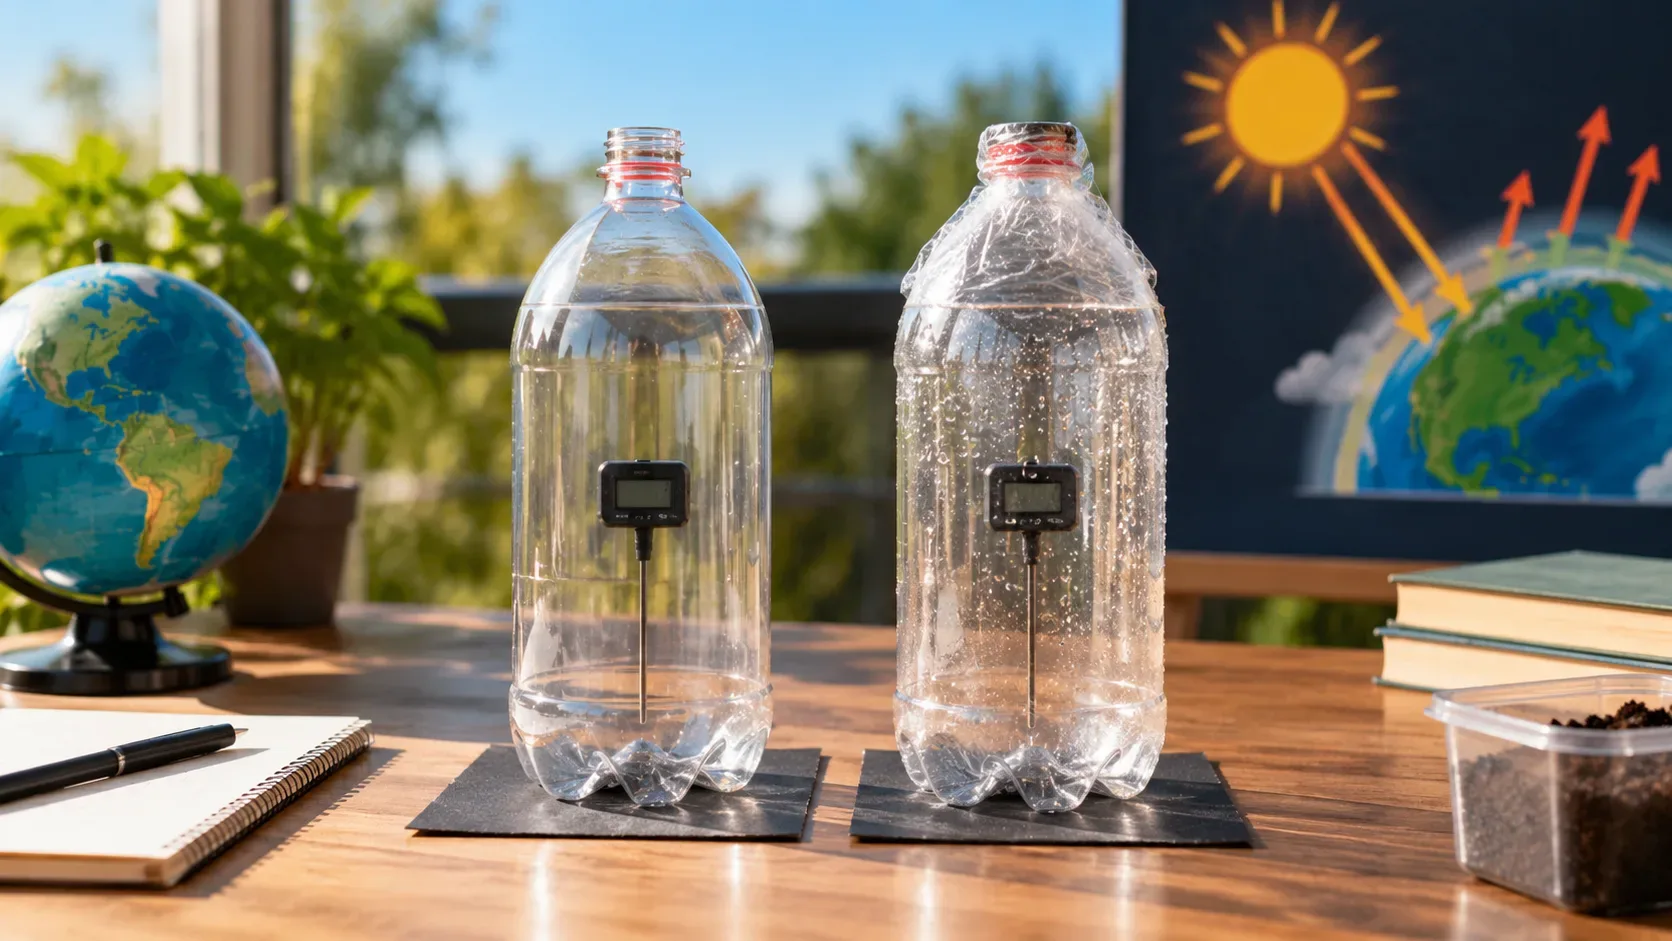
When framed with the right question, the experiment is useful. Two identical bottles exposed to the same energy source and measured with equivalent sensors allow students to observe how one change in the system affects temperature over time. If one bottle is left open and the other has its opening covered with transparent film, the cover reduces air circulation and can also reduce evaporative losses. That can change the rates of warming and cooling.
The scientific value is less about “copying Earth” and more about practicing four ideas:
- variable control: change one main condition at a time;
- time series: compare temperatures over time rather than relying on one final reading;
- replication: repeat the trial to see whether the pattern persists;
- model limits: ask which processes from the real system are represented and which are missing.
This framing is consistent with educational materials from the UCAR Center for Science Education, which treats models and simulations as tools for investigating relationships rather than complete copies of Earth’s climate.
A comparable protocol: two bottles, one main variable
Materials
- two transparent PET bottles of the same size and shape;
- two equivalent temperature probes or thermometers with similar resolution;
- equal amounts of a dark material at the bottom, such as black card or a shallow, equal layer of dry soil;
- clear, flexible plastic film to cover only one opening;
- a stable light-and-heat source, or direct sunlight during a short period of relatively steady conditions;
- a ruler or measuring tape to keep both bottles the same distance from the source;
- a timer and a data sheet.
If you use a lamp, keep it far enough away that it does not deform the PET or overheat the equipment. Do not close a warmed bottle with a rigid cap. In a school activity, the setup and heat source should be supervised by a responsible adult.
Setup
- Place the same amount of dark material in the bottom of both bottles.
- Position the sensors at the same height, without direct contact with the bottle wall or the material at the bottom.
- Leave one bottle open. Cover the opening of the other with clear plastic film, keeping everything else as similar as possible.
- Place the bottles side by side at the same distance from the energy source. Avoid letting one shade the other.
- Wait until the starting temperatures are close before beginning exposure.
Collecting data
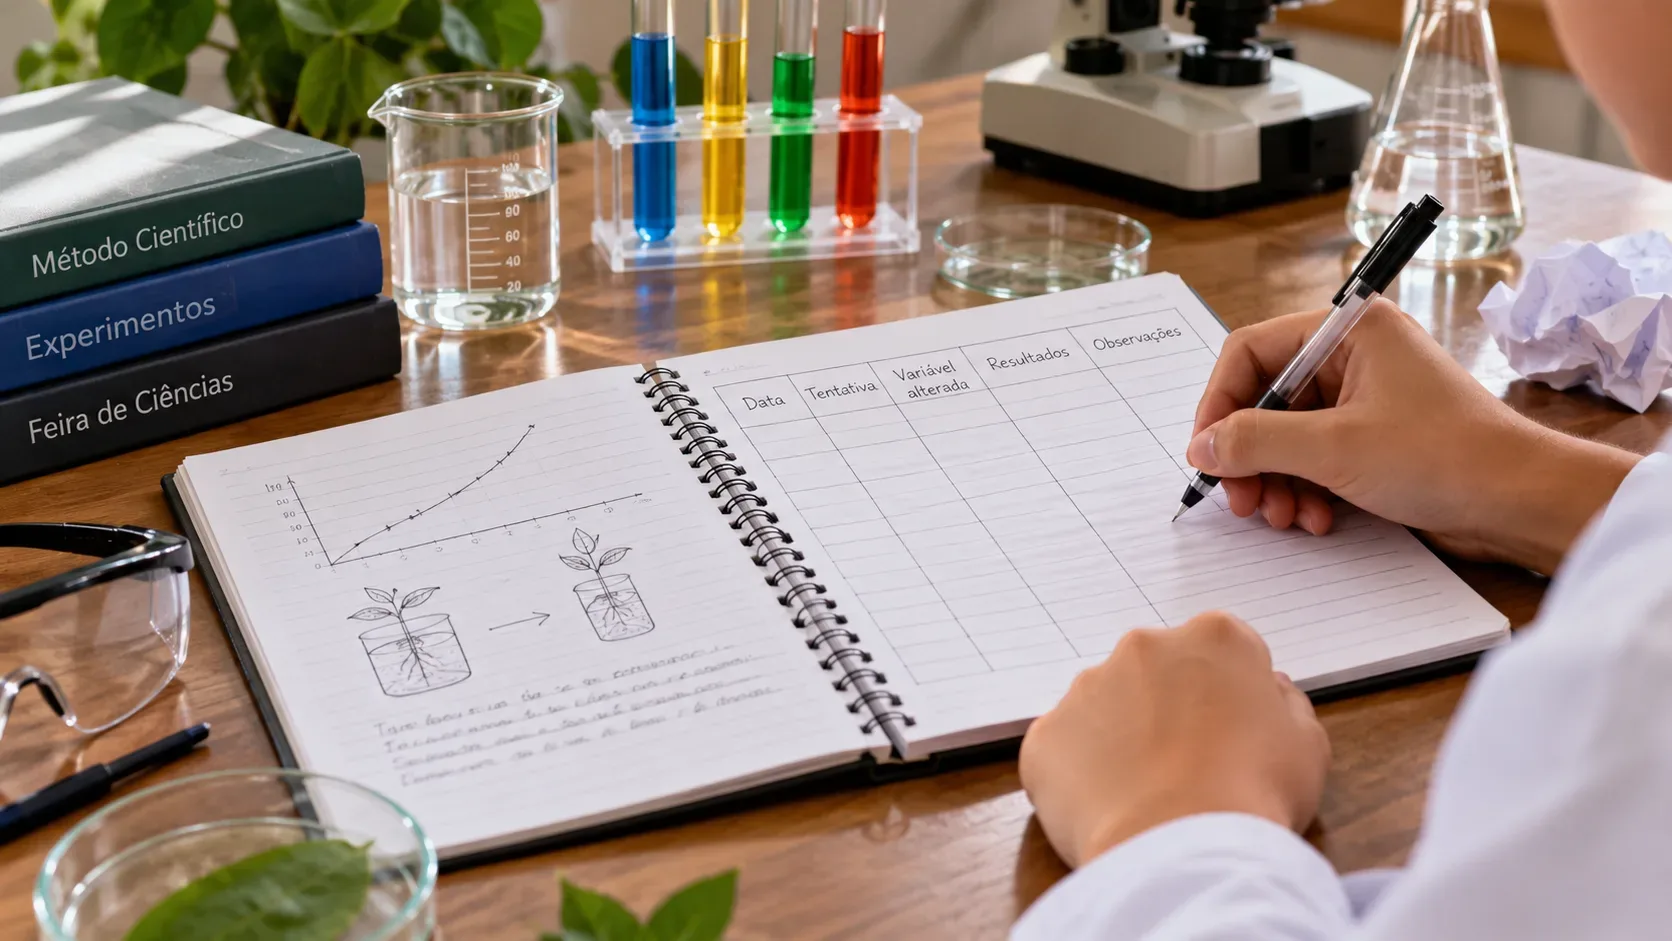
Record the starting temperature and then take readings at regular intervals. A simple example is every two minutes for 12 minutes and, if practical, continue for a few minutes after turning off or removing the source to observe cooling. What matters most is using the same interval for both containers.
| Time (min) | Open bottle (°C) | Covered bottle (°C) | Room temperature (°C) | Notes |
|---|---|---|---|---|
| 0 | ||||
| 2 | ||||
| 4 | ||||
| 6 | ||||
| 8 | ||||
| 10 | ||||
| 12 |
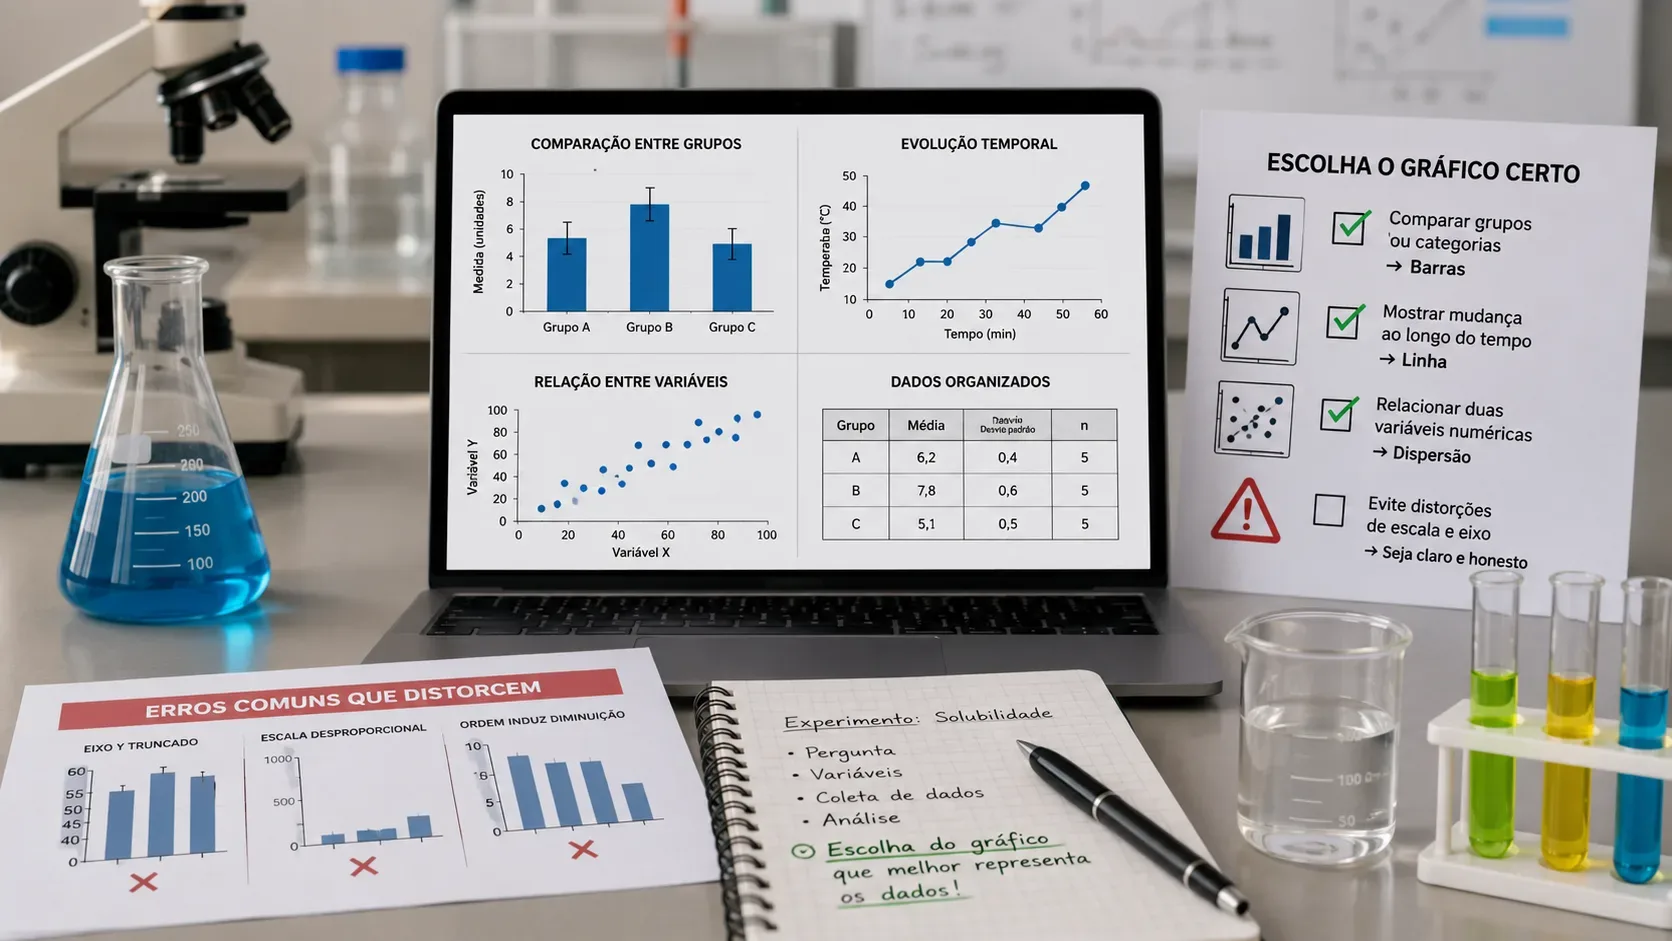
In addition to absolute temperature, calculate the change from the start for each bottle: ΔT = T(t) − T(0). A graph of temperature or ΔT versus time makes the comparison easier to interpret. Do not invent values to “complete” the table: a result with no measurable difference is still an experimental result and should be discussed.
How to make the comparison more reliable
Before drawing a conclusion, look for sources of bias. Sensors can differ slightly; one bottle may receive more light; a draft may hit only one side. Three simple improvements help:
- switch positions: repeat the trial with left and right reversed;
- repeat the test several times: compare the shapes of the curves, not just one isolated peak;
- record the surroundings: note clouds, drafts, room temperature, and any change in the light source.
If two sensors are available, test them side by side before the experiment to see whether they read similarly under the same condition. A fixed difference between instruments can be larger than the effect you are trying to measure.
What this experiment does not demonstrate
By itself, it does not demonstrate that carbon dioxide warms the atmosphere by absorbing infrared radiation. A covered bottle primarily changes air exchange with the surroundings; that is different from the radiative mechanism of the planetary greenhouse effect. NOAA explicitly notes that a physical greenhouse retains heat mainly by limiting convection, while greenhouse gases alter the loss of infrared energy to space.
It also does not, by itself, show how much Earth will warm when CO₂ concentration increases. Climate includes atmospheric and ocean circulation, clouds, water vapor, ice, albedo changes, evaporation, precipitation, and time and distance scales that two bottles cannot reproduce.
There is also an important warning for variants in which one bottle is filled with CO₂ and another with air. A paper in the Journal of Chemical Education showed that some benchtop demonstrations can attribute a temperature difference to the infrared effect of CO₂ when the difference is caused mainly by density and convection. In other words, a warmer CO₂ bottle is not enough to prove the atmospheric mechanism.
How to connect the experiment to the greenhouse effect without teaching the wrong analogy
The best strategy is to treat the setup as a model of heat retention in containers and then compare that model with the real atmosphere. Students can build a correspondence table with entries such as “energy source,” “absorbing surface,” “energy losses,” “air movement,” and “missing processes.” That turns the limitation into part of the lesson.
For the atmospheric mechanism, complement the hands-on activity with a photon visualization or material on infrared absorption. UCAR recommends simulations in which students distinguish incoming visible light from infrared radiation emitted by the surface. The Royal Society of Chemistry also separates the demonstration of a physical greenhouse, where convection is restricted, from arrangements designed to discuss radiation absorption by gases.
A conclusion the data can actually support
If the covered bottle warms more or cools more slowly in a repeatable way, a defensible conclusion is: under the conditions of this experiment, restricting exchange with the surroundings changed the container’s temperature evolution. The conclusion should not jump to “this proves Earth’s greenhouse effect.” The next step is to explain that the terrestrial greenhouse effect depends mainly on the absorption and re-emission of infrared radiation by specific gases, and that the bottle model contains different processes and major simplifications.
For a science fair, this distinction strengthens the project: the experiment stops being a demonstration that claims more than it measures and becomes an investigation of data, controls, and the limits of a scientific model.