A homemade sand-and-charcoal filter can make a water sample look clearer, but that is not the same as making it potable. The most useful science-fair experiment is to turn filtration into a measurable question: how much does appearance/relative turbidity change when the same water passes through a layered filter? The result should be presented as a reduction in visible particles and relative turbidity, not as proof that the water is safe to drink.
Short answer: the filter may clarify water, but it does not prove potability
Sand, gravel, cotton, and activated carbon can trap particles or adsorb some substances depending on the material, pore size, contact time, and filter design. This can improve apparent color, clarity, taste, or odor. However, different filters remove different contaminants. The CDC warns that many household filters are not designed to remove germs and that activated-carbon filters are often used mainly to improve taste and odor.
Turbidity is also only an optical characteristic. The USGS defines turbidity as a measure of the relative clarity of water related to light scattering by suspended material. In laboratories, it can be measured in nephelometric turbidity units (NTU). The visual scale in this experiment is not NTU and should not be presented as if it were.
Research question and hypothesis
Question: does passing a turbid test water through a homemade sand, gravel, and activated-carbon filter reduce its visual turbidity under standardized conditions?
Possible hypothesis: the filtered sample will have lower visual turbidity than the starting sample because some particles will be retained between the filter layers. Activated carbon may also change color and odor, but the experiment does not demonstrate removal of microorganisms or all dissolved contaminants.
Materials
- 1 clean, transparent PET bottle with the cap removed or safely perforated;
- cotton or a coffee filter to hold the layers in place;
- washed gravel;
- well-washed coarse and/or fine sand;
- granular activated carbon sold for filtration or aquarium use, rinsed according to the product instructions;
- matching transparent cups or beakers;
- graduated cylinder or measuring cup;
- stopwatch;
- phone for standardized photos;
- white card with thick black stripes or a simple printed grid;
- tap water and a small amount of soil/clay reserved for the experiment to make the test water.
Avoid barbecue charcoal, briquettes, or materials of unknown origin. They may contain binders, ash, or other substances not intended for this use. To reduce risk, do not use sewage, ditch, flood, lake, or river water; prepare test water only for the activity.
Assembling the filter
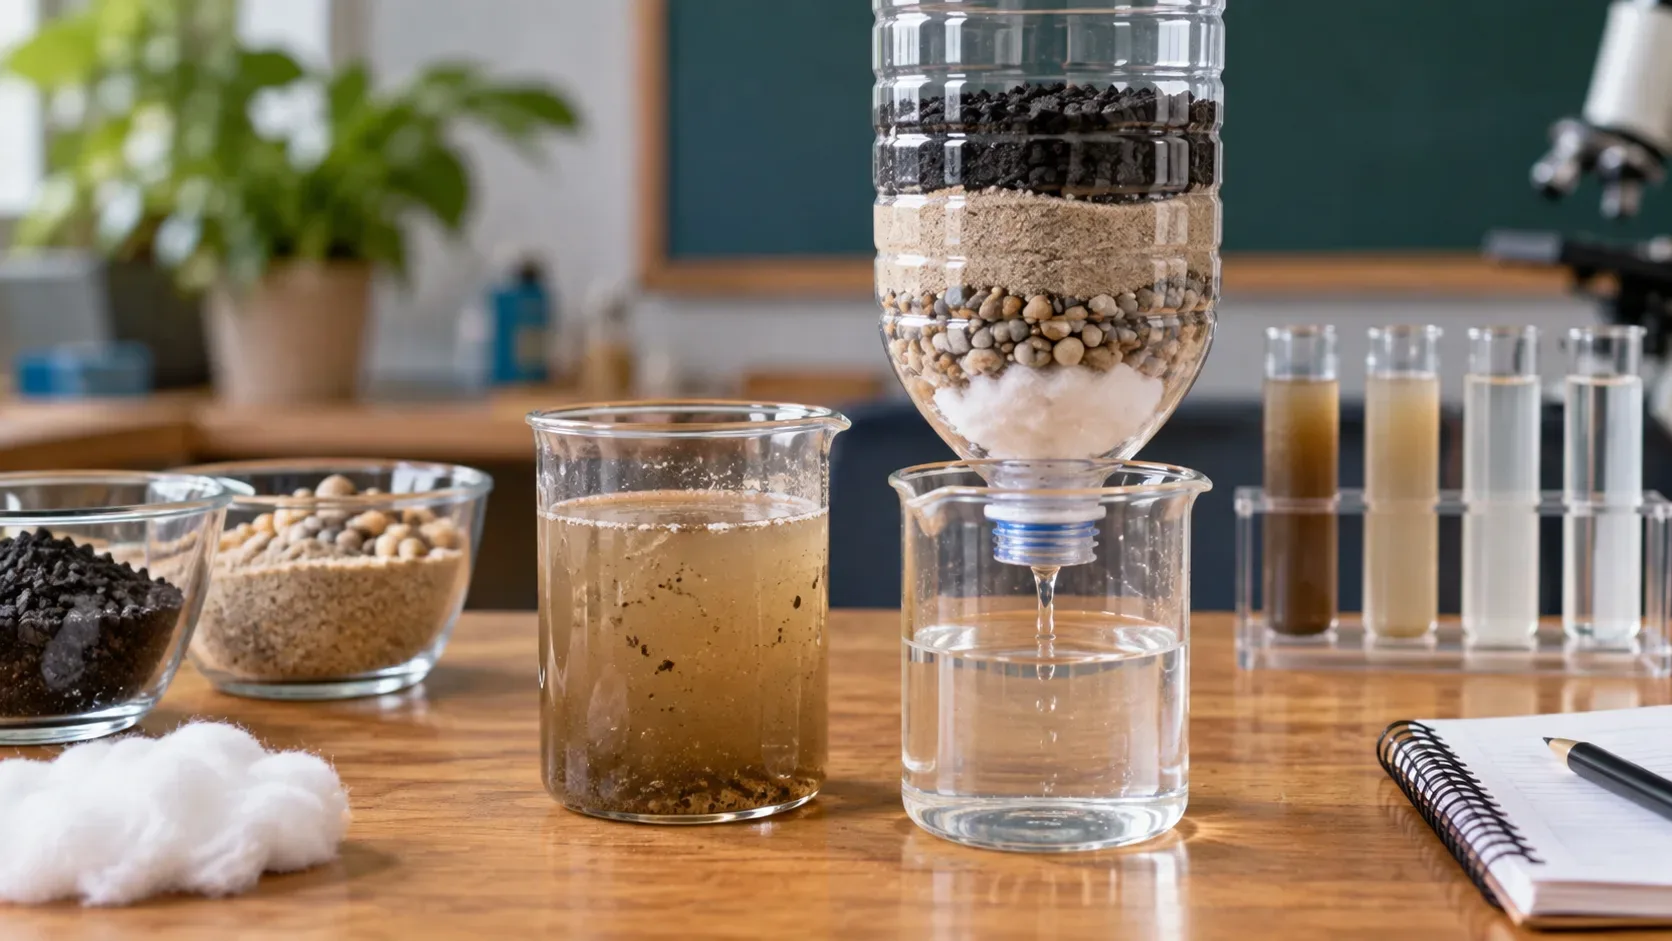
- Cut off the bottom of the bottle with adult supervision and protect any sharp edge.
- Turn the bottle upside down over a collection container.
- Place cotton or a coffee filter near the neck to keep solids from falling out.
- Add a layer of fine sand, then coarse sand, granular activated carbon, and gravel. The exact order can be a comparison variable, but it must remain the same across repeats of a given treatment.
- Rinse the assembled filter with clean water until excess carbon and sand dust is reduced. This conditioning water is not part of the measurement.
Use the same layer thickness and total filter volume in all trials you plan to compare. If you want to test two designs, such as “sand + gravel” and “sand + gravel + activated carbon,” build separate conditions and label them clearly.
How to prepare comparable test water
Mix a fixed amount of soil or clay into a fixed volume of tap water, for example 5 g in 1 L. Agitate it in the same way before taking each sample. The exact concentration can be adapted, but do not change the recipe in the middle of the experiment. Prepare a batch large enough for all repeats, because different mixtures may create a larger difference than the filter itself.
Keep a portion of the unfiltered test water as the control. It will be the “before” reference.
How to measure turbidity without pretending you measured NTU
Without a turbidimeter, the best school option is to create a relative visual index from standardized photographs. It is useful for comparing samples within the experiment; it cannot be used to declare compliance with official drinking-water standards.
- Always use the same transparent cup and the same sample volume.
- Place a white card with black stripes or a high-contrast grid behind the cup.
- Keep the camera at the same distance, height, and angle.
- Use the same lighting and avoid changing sunlight.
- If the phone allows it, lock focus and exposure so the camera does not automatically brighten a darker sample.
- Photograph the control and each filtrate side by side or at the same marked position.
Suggested visual scale
| Visual index | Criterion |
|---|---|
| 0 | The card stripes are fully sharp through the sample. |
| 1 | Stripes are sharp with a slight loss of contrast. |
| 2 | Stripes are visible but clearly faded. |
| 3 | Stripes are only partly visible and poorly defined. |
| 4 | Only thick shapes can be seen. |
| 5 | The pattern is almost impossible to see. |
This scale is ordinal: a drop from 4 to 2 means the water looked less turbid, but it does not mean “50% less turbidity.” A validated instrumental method would be required to obtain a physical unit comparable with standards.
Experimental protocol
- Agitate the test water for the same amount of time before each sample is taken.
- Measure a fixed volume, for example 250 mL.
- Photograph a portion of the control before filtration.
- Pour the 250 mL into the filter at a similar flow rate in every trial.
- Measure the time from the start of pouring until a defined volume is collected, for example 200 mL, or record the volume recovered after a fixed time.
- Photograph the filtrate under the same conditions as the control.
- Assign the visual index using the scale defined in advance.
- Repeat at least three times. If possible, ask two people to rate the photos without knowing which is “before” and which is “after,” reducing bias.
Results table
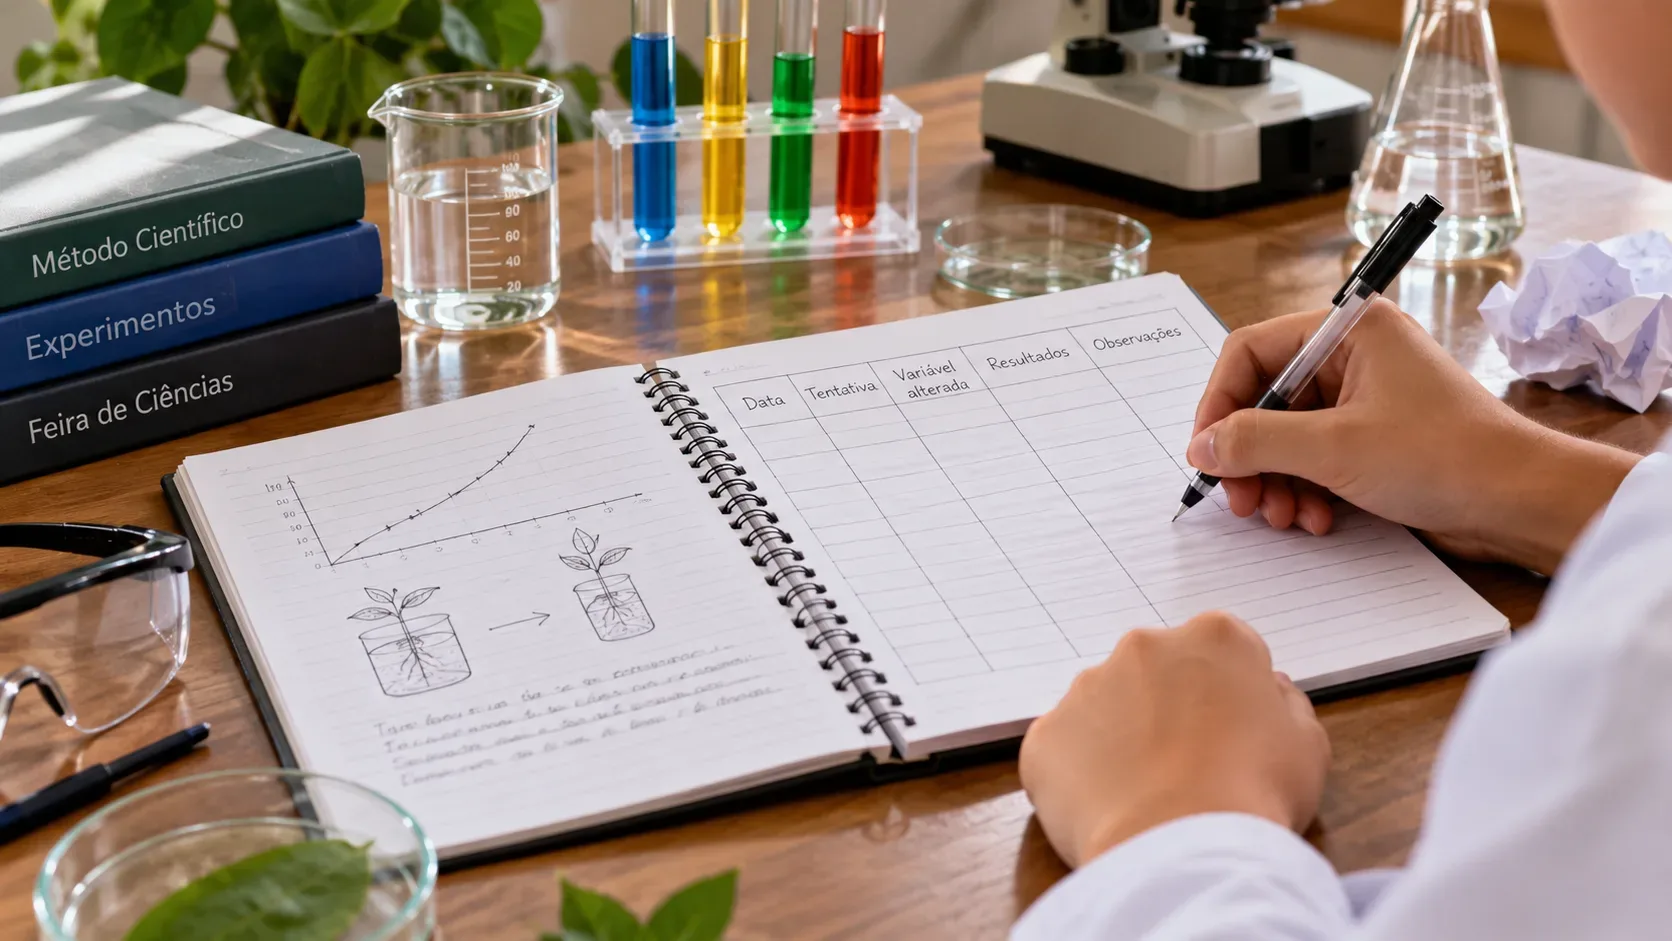
| Trial | Condition | Starting volume (mL) | Time (s) | Recovered volume (mL) | Visual index (0–5) | Notes |
|---|---|---|---|---|---|---|
| 1 | Before / control | fill in | — | — | fill in | color, particles, odor without close sniffing |
| 1 | After / filtered | fill in | fill in | fill in | fill in | fill in |
| 2 | Before / control | fill in | — | — | fill in | fill in |
| 2 | After / filtered | fill in | fill in | fill in | fill in | fill in |
| 3 | Before / control | fill in | — | — | fill in | fill in |
| 3 | After / filtered | fill in | fill in | fill in | fill in | fill in |
Report the median or range of the visual scores across repeats instead of inventing decimal precision. Filtration time and recovered volume can be treated as ordinary numerical measurements.
How to interpret the result
If the visual index consistently decreases across repeats, the appropriate conclusion is that the filter reduced the apparent turbidity of the test water under the experimental conditions. If the first filtrate comes out darker, carbon or sand dust may not have been rinsed enough. If flow becomes very slow, particles may have clogged the spaces between grains.
A strong report separates three ideas: (1) what was observed; (2) the likely mechanism; and (3) what was not tested. You observed appearance and flow. You may infer physical retention of some particles. You did not test bacteria, viruses, protozoa, metals, pesticides, salts, or other dissolved compounds.
Why the experimental water must not be drunk
Do not drink, taste, cook with, brush teeth with, or wash food with the filtered experimental water. Appearance is not a safety test. The CDC notes that harmful germs and chemicals may not change the look, taste, or smell of water, and that different filtration technologies have different capabilities.
In Brazil, the Ministry of Health Drinking Water Quality Standard treats potability as a set of control and surveillance requirements that include microbiological, chemical, organoleptic, and turbidity parameters. The current framework is Annex XX of Consolidation Ordinance GM/MS No. 5/2017, updated by Ordinances GM/MS No. 888/2021 and No. 2,472/2021. In collective systems, filtration and disinfection appear as steps with different functions. A school bottle filter neither reproduces nor validates that system.
Variables that can become follow-up tests
- With and without activated carbon: compare the visual index and filtration time.
- Sand depth: keep everything else constant and change only the layer height.
- Grain size: compare finer and coarser sand.
- Flow rate: observe whether pouring more slowly changes final clarity.
- Filter reuse: test how performance changes across several passes, without consuming the water.
In any extension, change one main variable at a time and keep the others constant. That turns the setup into an experiment rather than only a demonstration.
The result worth presenting at the science fair
A scientifically accurate presentation does not need to say “the filter purified the water.” It can make a more precise claim: “under the tested conditions, the sand, gravel, and activated-carbon filter reduced the visual turbidity of the test water, but the experiment did not evaluate potability.” That sentence connects observation, method limits, and safety — exactly what a good school investigation should do.