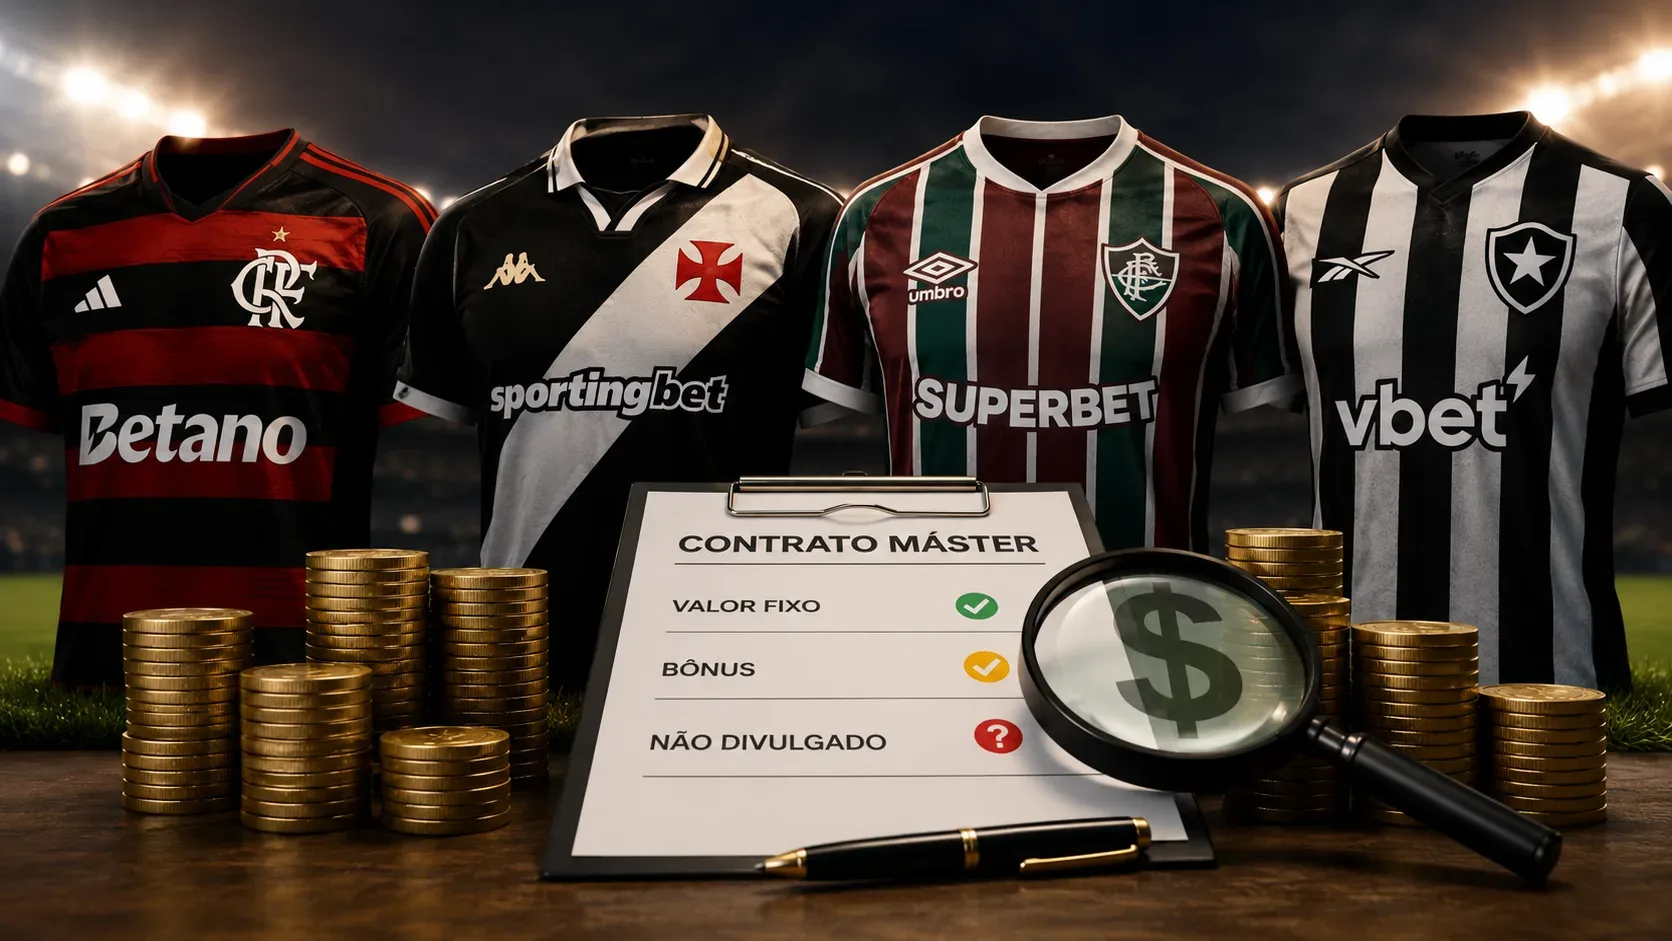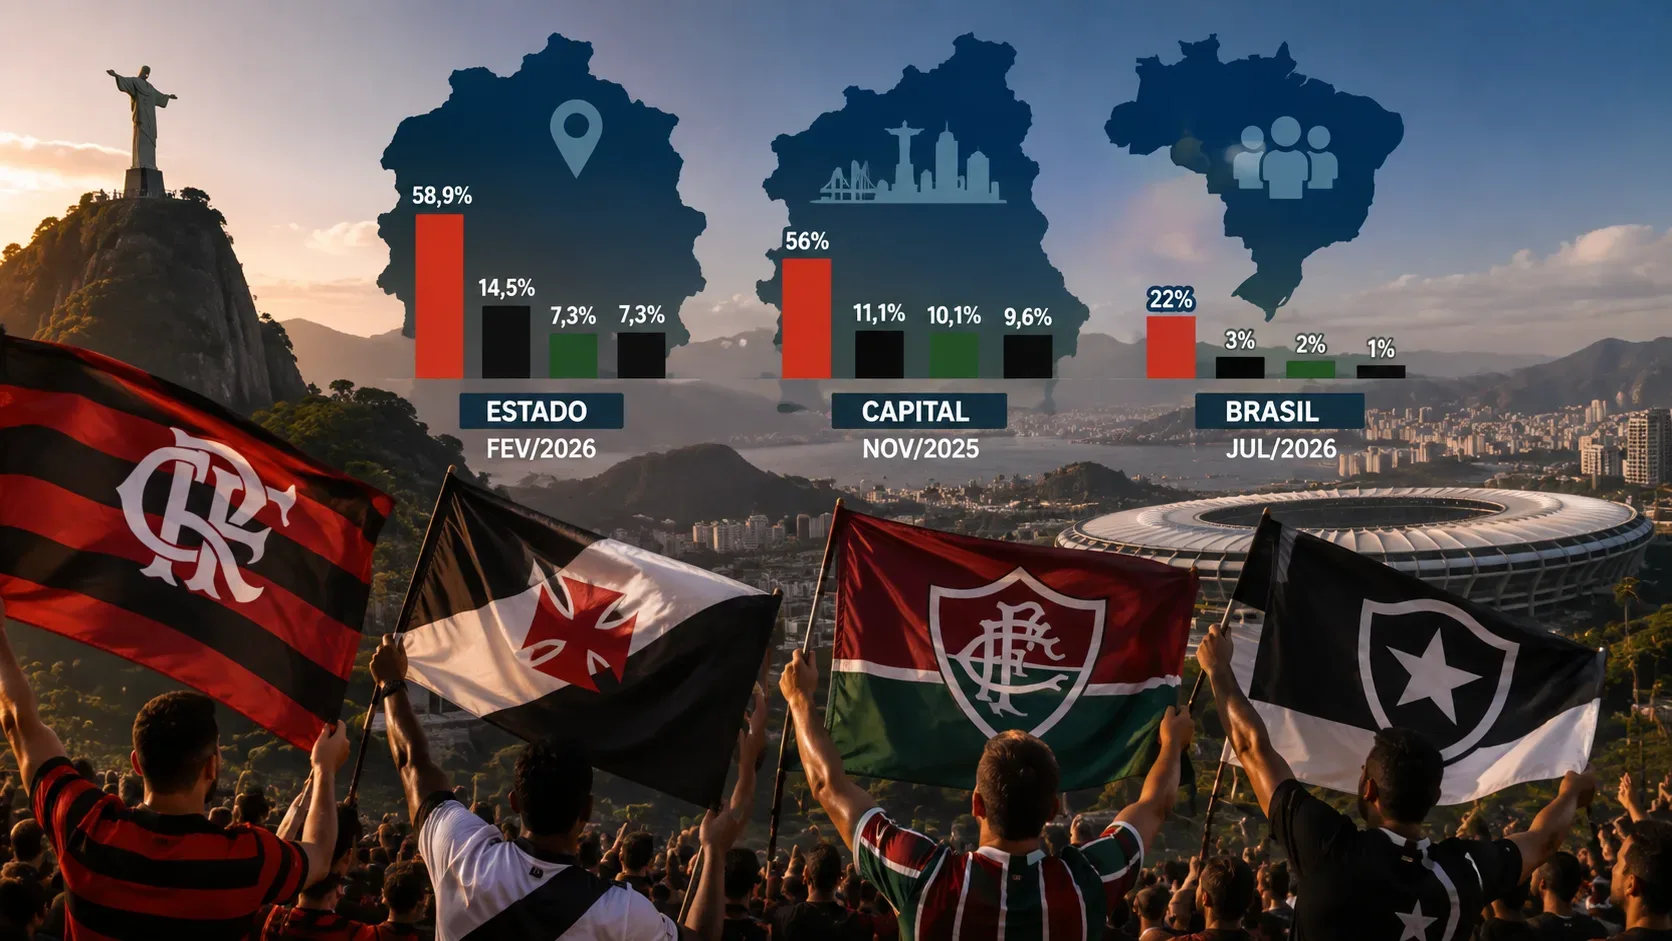

The annual balance sheets published in 2026 allow for a much cleaner comparison between Flamengo, Fluminense, Vasco and Botafogo, but the question "how much does each owe?" there is no single answer. To avoid mixing periods and concepts, the main base date for this analysis is December 31, 2025. The starting point is the total liabilities recognized in each entity's balance sheet and then the alternative metrics that each club uses to explain its debt come in.
In this common photograph, Botafogo SAF has the largest total liabilities, at R$2.011 billion. Vasco da Gama SAF appears with around R$1.096 billion. The Fluminense Football Club totals R$1.043 billion. In Flamengo, the answer depends on the perimeter: the controlling company records R$1.038 billion, while the consolidated amount reaches R$1.264 billion because it incorporates the subsidiary Fla-Flu Serviços S.A., linked to the Maracanã concession.
These values alone do not form a ranking of financial health. Total liabilities include obligations of different natures and with different maturities. Furthermore, net debt, operational debt and amounts subject to judicial recovery may remove, offset or remeasure portions that continue to appear in other concepts. Comparing Flamengo's R$174 million EOL with Botafogo's R$2.011 billion total liabilities, for example, would be comparing two different rules.
The first rule is to compare the same date and the same entity
The label "in 2026" describes the moment when the 2025 balance sheets were published and analyzed. For the central comparison, using December 31, 2025 is more consistent than combining this annual closing with June 2026 numbers from just one club. Flamengo has already published statements for the second quarter of 2026, but they are only included here as an update, not as a basis for the main ranking.
The entity also needs to be clear. Flamengo and Fluminense continue to be associations, although they have a stake in Fla-Flu Serviços S.A. The Vasco analyzed in the balance sheet is Vasco da Gama Sociedade Anônima do Futebol in Judicial Recovery. The Botafogo analyzed is S.A.F. Botafogo. Adding, without reconciliation, numbers of the associative club and SAF can duplicate transferred obligations, balances between related parties or debts already assumed by one of the structures.
In the red-black case, the financial statement itself shows how the perimeter changes the headline. On December 31, 2025, the parent company's liabilities were R$1.038 billion. Consolidated, it was R$1.264 billion. The difference arises from obligations incorporated by consolidation, including items from the company that operates the Maracanã concession. Therefore, anyone comparing the Flamengo association with Fluminense needs to say whether they are using the controlling company or the consolidated group.
Total liabilities, financial debt and net debt are not synonymous
Total liabilities are the accounting sum of obligations recognized in the balance sheet. It may include suppliers, athlete acquisition installments, taxes, labor obligations, loans, leases, provisions, customer advances and revenue received before being recognized in profit or loss. It is a broad measure of the stock of bonds on a specific date.
Financial debt is a narrower measure. It normally looks at loans and financing, but may leave out relevant portions for a football club, such as installment purchases of players, installment taxes and legal settlements. Fluminense illustrates this well: it had only R$37.8 million in loans and financing at the end of 2025, but its total liabilities exceeded R$1 billion.
Net debt requires even more care because there is no single mandatory formula adopted by all clubs. A metric can discount cash; another may also discount accounts receivable; another may exclude advances, provisions or amounts without immediate financial disbursement. Without reading the definition, the isolated number is not comparable.
Flamengo: R$1.04 billion in the parent company, R$1.26 billion in the consolidated and EOL close to R$174 million
The comparative balance included in the statements for the second quarter of 2026 confirms the values as of December 31, 2025. Flamengo had R$592.3 million in current liabilities and R$445.9 million in non-current liabilities at the parent company, totaling R$1.038 billion. Consolidated, there were R$646.6 million in the short term and R$616.9 million in the long term, totaling R$1.264 billion.
The composition helps to understand why this total should not be confused with the debt metric that the club usually highlights. In the consolidated, suppliers and other obligations totaled R$572.3 million between short and long term; taxes and social contributions, R$232.7 million; labor and social obligations, R$64.0 million. There were also R$142.8 million in advances received and R$179.5 million in grants for the use of public assets.
Flamengo monitors the Net Operating Debt, the EOL. The club itself defines this indicator as obligations to suppliers, other clubs, employees and the government, less cash and amounts receivable from customers and other clubs. Applying this logic to the consolidated balances as of December 31, 2025, the indicator is approximately R$174 million, a number released for the end of the year. It is much smaller than total liabilities because the formula offsets a relevant part of obligations with resources and receivables.
The club reported record gross revenue of R$2.089 billion in 2025 and a surplus of more than R$335 million. This does not automatically reduce liabilities, but it gives context to the resource generation capacity. On June 30, 2026, after a strong cycle of investment in the squad, the EOL was R$280.2 million. This most recent data shows why the base date needs to be locked before comparing with the other three clubs.
Fluminense: R$1.043 billion in liabilities, including taxes and athlete purchases
Fluminense ended 2025 with R$483.8 million in current liabilities and R$559.1 million in non-current liabilities. The sum, R$1.043 billion, is the total liability recognized in the balance sheet. Shareholders' equity was negative at R$182.0 million, a situation described in the statements as uncovered liabilities.
The composition is decisive. Taxes in installments totaled R$470.0 million. Accounts payable for player transfers totaled R$244.2 million. Loans and financing totaled R$37.8 million. The structure, therefore, is very different from a company in which most of the debt comes from banks.
In the management disclosure, Fluminense said that the debt reached R$1 billion and that, excluding the amount to be paid for investment in players, it was R$812 million. This R$812 million is not obtained by simply subtracting the R$244.2 million in accounts payable by athletes from the total liabilities of R$1.043 billion, an operation that would result in around R$799 million. The difference is a practical warning: "debt" in management presentation may use adjustments that do not appear in the metric title. Without calculation memory, it should not be treated as an automatic synonym for total liabilities.
The club recorded net operating revenue of R$758.5 million and a surplus of R$51.6 million in 2025. In its communication, it reported gross revenue exceeding R$1 billion when considering the other lines that make up its revenue presentation. Again, net operating income and gross revenue are not the same column.
There is also a relevant audit caveat for any comparison. BDO pointed out, among other topics, contingencies classified as probable loss that exceeded the recognized provision by approximately R$34.2 million. The auditor also recorded an accounting treatment related to Futebol Forte União which, in his assessment, overvalued assets and undervalued results and net equity by R$110.4 million. This does not make the balance sheet useless; means that the degree of accuracy of the reading needs to incorporate the auditor's opinion.
Vasco SAF: R$1.096 billion in liabilities, but the judicial recovery changes the book value of part of the debt
Vasco da Gama SAF ended 2025 with around R$384.5 million in current liabilities and R$711.8 million in non-current liabilities, a total of approximately R$1.096 billion. Shareholders' equity remained negative at around R$647.5 million.
The most important point is judicial recovery. The obligations subject to the plan totaled R$457.9 million in nominal value, approximately R$11.1 million in the short term and R$446.7 million in the long term. After discounts provided for in the plan and adjustment to present value, the book value of these obligations was close to R$219.5 million. Thus, two headlines can quote R$457.9 million and R$219.5 million without one of them being, in itself, wrong: one talks about the nominal credit subject to the plan, the other about the value recognized in the balance sheet after the effects of the restructuring.
The 2025 result also needs this footnote. SAF showed a profit of R$81.2 million, but the opinion of the Supervisory Board recorded that, without the accounting effects of the judicial recovery plan, the year would have presented a loss of around R$232 million. It is an example of how financial restructuring can significantly change the result of a year without meaning, in itself, that the current operation started to generate sufficient cash.
Revenue disclosures also show why the column needs to have a full name. The income statement showed net operating revenue of around R$413.8 million, while broader sums of operations and transactions with athletes produce higher numbers in presentations and reports on the balance sheet. To compare payment capacity, the ideal is to use the same definition of revenue between all clubs, not the biggest headline available for each one.
Vasco's audit report came with reservations and limitations on several items that could not be fully verified within the issuance period. This needs to accompany any number presented as the definitive SAF snapshot on December 31, 2025.
Botafogo SAF: R$2.011 billion in the final balance sheet and why R$2.753 billion was also circulated
The final financial statements of S.A.F. Botafogo recorded R$1.348 billion in current liabilities and R$662.8 million in non-current liabilities on December 31, 2025. Total consolidated liabilities were R$2.011 billion. Net equity was negative at R$431.9 million.
Short-term pressure is a central feature of this balance sheet: around two-thirds of the liabilities were classified as current. Among the largest consolidated items were suppliers and accounts payable, which totaled R$1.168 billion between short and long term, and tax obligations of approximately R$401.0 million. There was also R$227.0 million in revenue deferred between short and long term, an item that helps explain why some management statements present an "adjusted debt" lower than total liabilities.
Before the publication of the final statements, an economic evaluation report prepared by Meden Consultoria and released in April presented another picture: R$ 1.643 billion in current liabilities and R$ 1.110 billion in non-current liabilities, a total of R$ 2.753 billion. The annual balance made available at the end of April brought R$2.011 billion. As they are documents with different purposes and closing stages, the report number should not be mixed with the final balance sheet as if it were the same accounting photograph.
In the 2025 income statement, gross operating revenue was R$655.0 million and revenue from athlete rights transactions was R$733.4 million. Added together, these two gross lines amount to around R$1.388 billion, the basis for reporting revenues of around R$1.4 billion. The loss for the year was R$290.9 million.
The strongest reservation among the four cases is in the Botafogo auditor's report. BDO refrained from expressing an opinion because it reported that it had not obtained sufficient appropriate audit evidence to support a conclusion. Among the points mentioned were uncertainties about operational continuity, external confirmations from financial institutions and related parties and recoverability of accounts receivable from related companies. Therefore, R$2.011 billion is the value presented in the final statements, but the reliability of the measurement must be read together with the abstention of opinion.
So who owes more?
If the ruler is exclusively the total liabilities recognized in the statements as of December 31, 2025, the order starts with Botafogo SAF, with R$2.011 billion. Then comes the consolidated Flamengo, with R$1.264 billion, if the perimeter includes the subsidiary of the Maracanã concession. Vasco SAF appears with approximately R$1.096 billion. Fluminense, with R$1.043 billion, and controlling Flamengo, with R$1.038 billion, are very close in nominal value.
This order changes meaning when the entity or metric changes. If Flamengo's comparison uses only the controlling company, it goes from R$1.264 billion to R$1.038 billion. If someone exchanges total liabilities for EOL, Flamengo appears close to R$174 million at the end of 2025. If Vasco is analyzed only by the book value of debts subject to judicial recovery, R$219.5 million appears, but this does not replace SAF's total liabilities. If Botafogo is measured by the report published before the final statements, R$ 2.753 billion emerges, a document that is not equivalent to the balance sheet published afterwards.
Therefore, the responsible ranking needs to carry five labels next to each number: base date, accounting concept, entity covered, revenue definition used for context and source. When there is an audit with reservations or a disclaimer of opinion, this status must also appear. Without this information, the comparison may be mathematically correct and editorially misleading.
What R$1 billion in liabilities can hide
Two clubs with liabilities of around R$1 billion can have very different financial pressures. A tax obligation spread over many years does not have the same cash flow effect as an athlete purchase maturing in months. An advance of income can be an accounting liability without representing a bank account payable in the same sense as a loan. A debt renegotiated in judicial recovery can maintain a high nominal value and carry a lower book value after discount and discount to present value.
It is also necessary to look at the other side of the balance sheet. Cash, accounts receivable, athlete assets, real estate and investments influence the ability to absorb obligations, but should not be deducted from liabilities without an explicit formula. This is exactly why Flamengo's EOL produces a figure so far from total liabilities: the indicator deducts cash and receivables within a methodology defined by the club itself.
Income is another dimension, not a substitute for debt. Revenue measures flow over a period; Liability measures stock of obligations on a date. A club can make a lot of revenue and still carry high liabilities, or have lower liabilities and low cash generation. To transform the numbers into a sustainability diagnosis, it would be necessary to go beyond this comparison and analyze maturities, operational cash generation, liquid assets, financial costs and refinancing capacity.
Method to read the next rankings without falling into the single number trap
The safest way to check a ranking is to start with the financial statement and locate the balance sheet date. Then, identify whether the number belongs to the association, SAF, the parent company or the consolidated entity. Then check whether the column is total liabilities, loans, net debt, operating debt or credit subject to a recovery plan. Only then is it worth comparing the revenue, using the same definition and the same period.
The publication date also matters. The Botafogo case shows how a report released weeks before the final balance sheet can continue to circulate after the annual statement presents another liability. Flamengo's case shows the opposite problem: data from June 2026 may be newer, but it should not be placed on the same line of numbers as rivals closed in December 2025 without warning.
With this discipline, the question "who owes more?" it stops being a fight for headlines and becomes an auditable comparison. In the common base of December 31, 2025, Botafogo SAF has the largest total liabilities presented. But what really differentiates the four is the composition, term, corporate perimeter and the quality of the accounting evidence behind each figure.
Primary sources and traceability notes
Flamengo. Transparency Report and Financial Statements for the 2nd quarter of 2026, with comparative balance as of December 31, 2025 and definition of the EOL. Official source: https://images.flamengo.com.br/public/arquivos/transparencia/17/1785444905014.pdf. Transparency page: https://www.flamengo.com.br/transparencia/demonstracoes-financieiras. Accessed August 19, 2026.
Fluminense Football Club. Financial statements for 2025 and independent auditor’s report. Official source available on federation transparency: https://static.fferj.com.br/media/upload/transparencia/0f1fc1ce61a e4dab9e640564f25be792.pdf. Official communication from the club about the balance sheet: https://www.fluminense.com.br/noticia/fluminense-divulga-balanco-com-receita-recorde-de-r-1-bilhao-superavit-pe lo-quarto-ano-seguido-e-investimento-inedito-em-ologistaes. Accessed August 19, 2026.
Vasco da Gama SAF. Financial statements for 2025. Official source: https://media.vasco.com.br/static/2026/04/VASCO_DEMONSTRACOES_CONTABEIS_2025_.pdf. Official transparency page: https://vasco.com.br/transparencia/. To check the report's figures in a navigable format, ge was also consulted at https://ge.globo.com/futebol/times/vasco/noticia/2026/05/01/vasco-div ulga-balanco-financeiro-da-saf-com-aumento-da-receita-e-divida-superior-a-r-1-bilhao.ghtml. Accessed on 19th
August 2026.
S.A.F. Botafogo. Financial statements for 2025. Official source: https://static.botafogo.com.br/upload/downloads/0bd2ba736f7044bba40f7c01acf69ae8.pdf. Official statement: https://www.botafogo.com.br/noticias/balanco-2025. To distinguish the valuation report published before the final statements, the ge record was consulted at https://ge.globo.com/futebol/times/botafogo/noticia/2026 /04/11/laudo-aponta-divida-a-curto-prazo-de-r-16-bilhao-e-prejuizo-operacional-em-2025-no-botafogo.ghtml. Accessed August 19, 2026.
The values have been rounded in the text to facilitate reading, preserving the exact figures when they are decisive for comparison. The main criterion is the total liability recognized as of December 31, 2025; management metrics, judicial recovery adjustments and preliminary document numbers appear separately to avoid undue equivalence.