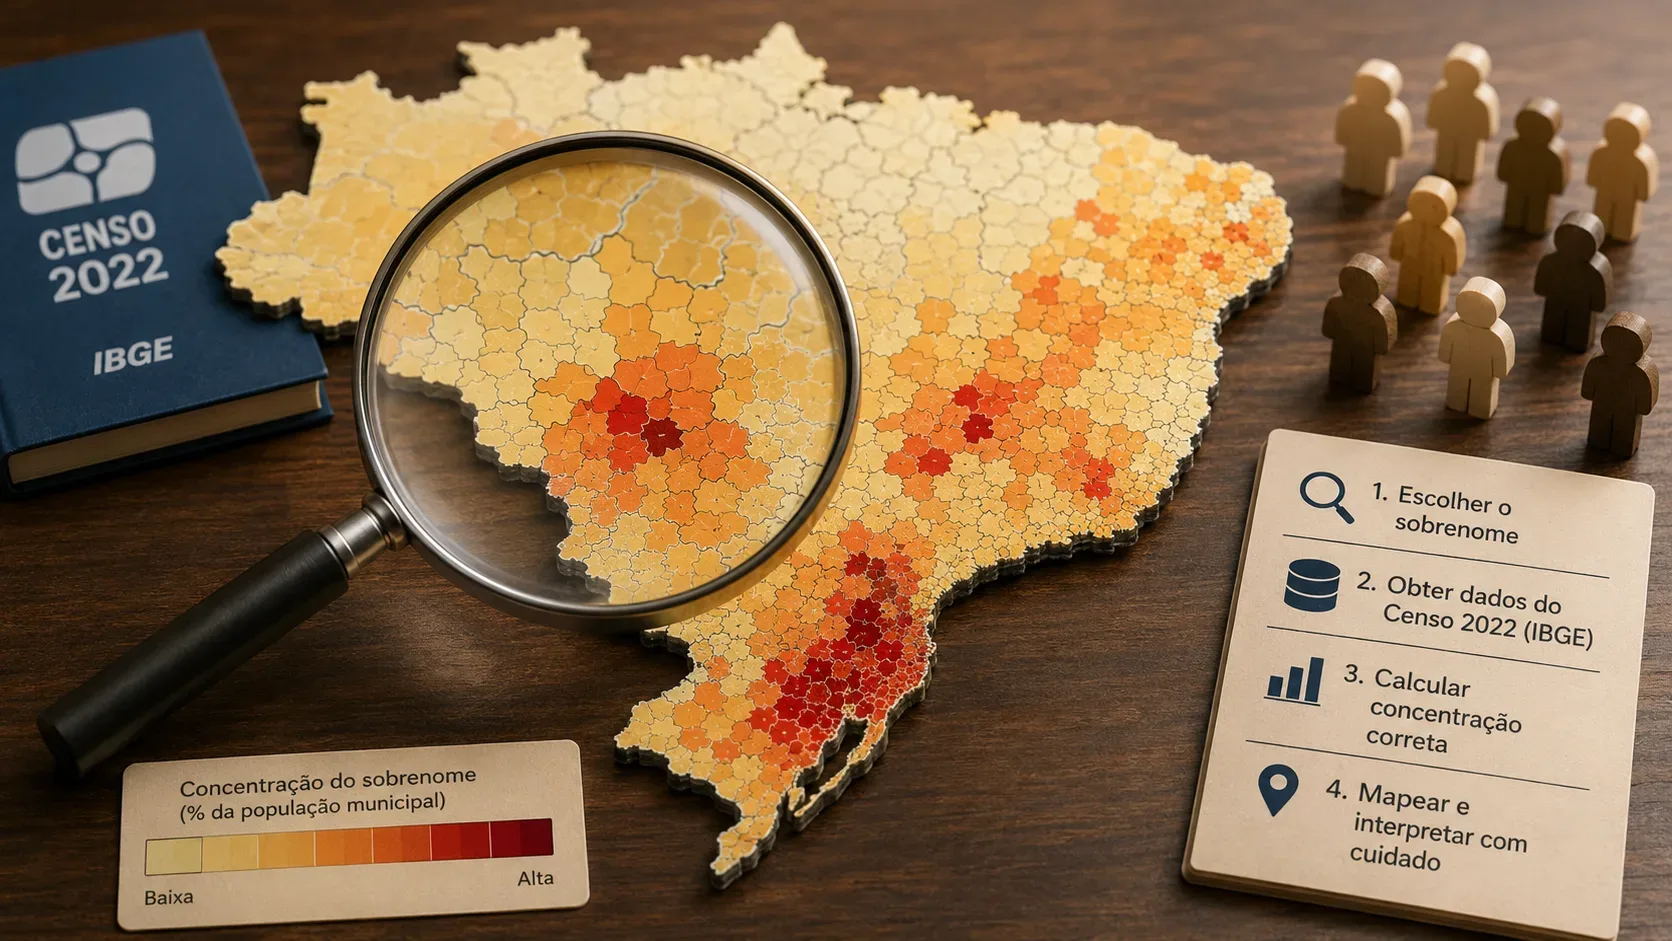
If the question is “where is my surname most concentrated in Brazil?”, the most useful figure is not the municipality with the largest number of people, but the share of the local population that carries the surname. A large city may contain thousands of people with the same surname and still have a lower concentration than a small town.
On November 4, 2025, IBGE released the new edition of Nomes no Brasil, based on the 2022 Population Census and, for the first time, including surnames. Its reference date is the resident population on August 1, 2022. The release covers Brazil, 27 states/federal units and 5,570 municipal units, using records from about 203 million people in 90.7 million households. The official product page and Technical Note 01/2025 explain how names and surnames were processed.
What “surname concentration” actually measures
To compare municipalities of different sizes, think of concentration as the share of the local population that has the surname being searched:
concentration = people with the surname in the municipality ÷ municipal population
Imagine two cities. In the first, 500 of 5,000 residents have the surname: the concentration is 10%. In the second, 20,000 of 1 million residents have it: the concentration is 2%. The second city has far more people in absolute terms, but the first is proportionally more concentrated.
| Measure | What it answers | What it does not prove |
|---|---|---|
| Count | How many people have the surname in the place | That the place is the main proportional cluster |
| % of population | How concentrated the surname is locally | Your family's genealogical origin |
| Ranking | The surname's position among the most frequent | Kinship among people with the same spelling |
| Etymological origin | The linguistic history or meaning of the surname | The birthplace of a specific ancestor |
A 4-step method to build your own concentration map
1. Search the exact spelling shown by IBGE
Start with 2022 Census — Nomes no Brasil and find the surname. The methodology states that spelling variants were counted separately as recorded during the census. Different spellings should therefore be treated as different searches. At the same time, diacritical marks — such as accents, cedillas and tildes — were not considered in the published processing.
This matters when a surname has historical or orthographic variants. Do not automatically add similar-looking versions together; first check whether the system presents them separately.
2. Compare municipalities by percentage, not just by count
For the geographic distribution, record at least four fields for each municipality: municipality, state/federal unit, number of people with the surname, and percentage of the local population. If your goal is to find concentration, sort the table by percentage.
The absolute count is still useful because it shows the size of the group. On its own, however, it favors populous municipalities and can hide small towns where the surname represents a much larger share of residents.
3. Put the percentage on the map
For a custom map, use the percentage as the color variable. The larger the surname's share of the municipal population, the stronger the visual class can be. Avoid coloring by the total number of people when the question is “where is it most concentrated?”.
If you are comparing dozens of municipalities, use consistent classes for all of them — for example, percentage bands defined before examining individual towns. This reduces the risk of changing the scale merely to highlight an expected result. Keep the count next to the percentage as well, because a very high rate based on few disclosed records deserves more cautious interpretation.
4. Read the spatial pattern as a demographic clue, not a family tree
A cluster of neighboring municipalities may suggest regional persistence, migration, marriage networks, historical settlement or other population processes. But the map does not identify a founding ancestor, nor does it demonstrate that everyone with that surname belongs to the same lineage.
The most useful approach is to turn the map into a priority list of places to investigate. Then compare those places with birth, marriage and death certificates, civil or parish registers, immigration documents, probate records and other sources tied to your actual family.
Three mistakes that completely change the interpretation
Mistake 1: “the municipality with the most people is the surname's origin”
Not necessarily. Large municipalities accumulate more people with almost every common surname. Use percentages to study concentration. Use genealogical documentation to study family trajectories.
Mistake 2: “a dark spot on the map proves my family came from there”
The 2022 Census map portrays residence on August 1, 2022, not the place of origin of earlier generations. A present-day concentration can result from recent or old migrations and can include lineages with no close relationship.
Mistake 3: “same spelling means same lineage”
Surnames can arise in different families, be transmitted through different branches, or change form over time. Statistical frequency measures occurrence of the term; it does not establish kinship.
A surname missing from a municipality may not mean zero
Minimum disclosure thresholds protect confidentiality. According to IBGE's release, geographic distribution is shown only when the term has an incidence above 15 in a state/federal unit and above 10 in a municipality; the same protection applies to decade filters. IBGE materials also state a minimum frequency of 20 for display at the Brazil level.
So a municipality with no visible result may still contain occurrences below the disclosure threshold. Absence from the interface should not automatically be converted into “no one”. For the same reason, totals calculated only from displayed locations can be lower than state or national totals.
What IBGE counted as a surname
In the 2022 Census collection, given name and surname were recorded in separate fields. For surnames, interviewers were instructed to record the resident's remaining surnames, preferably the complete name and, when that was not possible, only the last surname. For publication, IBGE calculated surname frequencies without regard to the order in which the surnames were recorded.
This means the result should not be interpreted as a ranking exclusively of “last surnames” or as a count of families. It is a statistic of the occurrence of surnames recorded in the resident list.
How to turn the map into better family research
- Start with the percentage: mark municipalities where the surname makes up the largest share of the population.
- Check group size: also look at the absolute count and the disclosure thresholds.
- Compare with your records: look for matches with places of birth, marriage and death of known relatives.
- Expand to neighboring municipalities: current administrative borders do not always match historical areas of family movement.
- Separate etymology from genealogy: the linguistic history of a surname can provide context, but it does not replace a documented chain from one generation to the next.
Checklist before concluding that you found a “family cradle”
- Am I using percentage or only count?
- Is the municipality small or large?
- Could the result be affected by the minimum disclosure threshold?
- Am I comparing the same surname spelling everywhere?
- Do I have documents connecting my ancestors to this municipality?
- Am I confusing the surname's etymological origin with the origin of my lineage?
The Nomes no Brasil map is excellent for answering where a surname occurs and where it is proportionally most concentrated in the 2022 Census snapshot. The genealogical answer comes later, when the statistical pattern is tested against documents capable of linking one generation to the next.