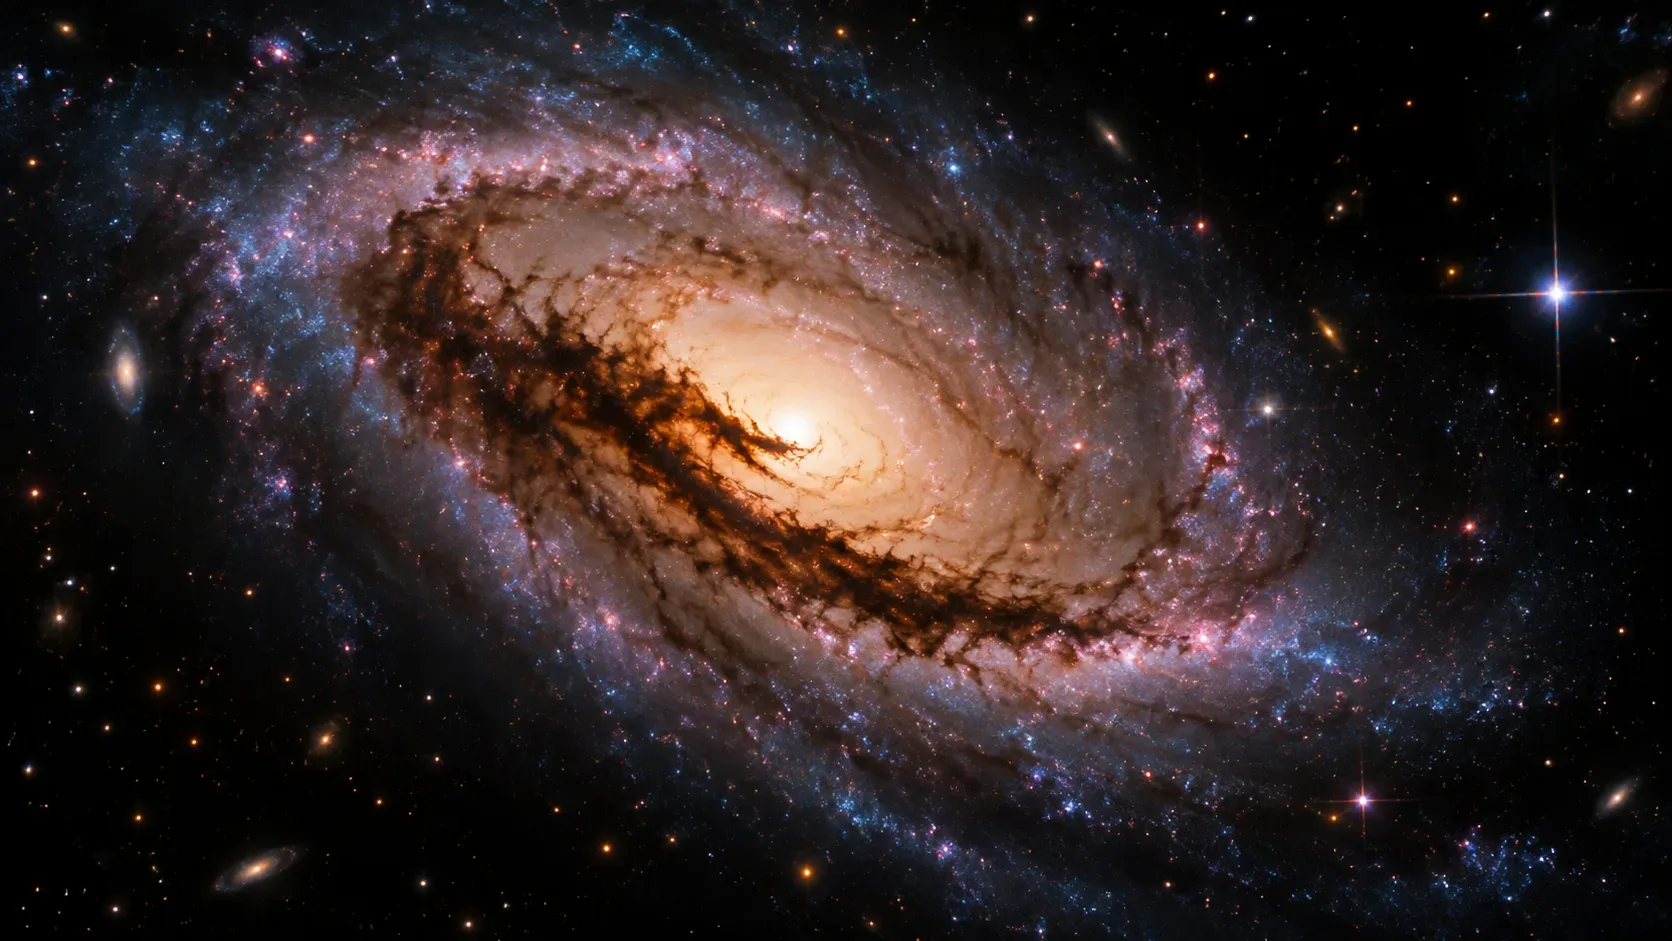
On September 16, 2026, NASA's Astronomy Picture of the Day highlighted a comparison of Messier 64, the Black Eye Galaxy, placing a Hubble view alongside a composite that includes James Webb data. The comparison is especially useful because it turns M64 into a lesson in multiwavelength astronomy: the same dust lane that looks dark when it blocks some starlight can become a luminous structure when observed in the mid-infrared. The Hubble + Webb composite is dated March 20, 2026, and had already been presented by NASA before the September feature.
M64 lies about 17 million light-years away in the constellation Coma Berenices. Its nickname comes from a dust lane crossing the bright region near its nucleus. The key point of the comparison is not that one telescope shows the true version while the other shows an incomplete one. Each part of the spectrum responds to different physical components. Together, they help separate stars, gas, dust, and star-forming regions.
Why M64 looks like it has a black eye
In visible light, interstellar dust absorbs and scatters some of the light coming from stars behind it. When a dust cloud is projected against a very bright background, the result can be a dark band. That contrast gives M64 its characteristic appearance.
Hubble shows this geometry in sharp detail. In observations that combine ultraviolet, visible, and near-infrared light, young hot stars, bluish clusters, and ionized hydrogen regions associated with star formation stand out. At the same time, the dust lane still acts as a silhouette in front of the galaxy's luminous bulge.
Hubble's official M64 page states that the image released in March 2026 uses Wide Field Camera 3, an instrument that spans ultraviolet, visible, and near-infrared wavelengths. That broad coverage matters because the image is not simply an ordinary visible-light photograph: it already combines different bands to emphasize structures the human eye alone would not perceive.
What changes when Webb moves into the infrared
James Webb was designed to observe primarily in infrared light. Its instruments cover wavelengths from visible red and the near-infrared into the mid-infrared. NIRCam works mainly from 0.6 to 5 microns, while MIRI reaches longer wavelengths, roughly 4.9 to 28 microns.
This changes the role of dust in the image. Dust absorbs shorter-wavelength radiation and can re-emit energy in the infrared. As a result, regions that are dark in some Hubble images can reveal emission and structure when observed by MIRI. In the view highlighted by NASA in September, M64's dust is shown in red in the Webb-related composite because invisible infrared data have been translated into visible colors for display.
This does not mean Webb simply sees through all dust. Near-infrared light can pass through some regions where visible light is more strongly blocked, while mid-infrared observations also record emission from the dust itself. The amount of material, grain properties, temperature, and observed wavelength all affect how much of a structure becomes visible or remains hidden.
What appears and what fades at each wavelength
| Band and instrument | What tends to stand out in M64 | What may become less obvious | What astronomers can investigate |
|---|---|---|---|
| Hubble: ultraviolet | Young hot stars and regions linked to recent star formation | Areas heavily obscured by dust | Where recent star formation is strongest |
| Hubble: visible and near-infrared | Stellar distribution, bright bulge, spiral structure, and the dust lane in silhouette | Structures deeply hidden behind dense dust | Galaxy morphology and the relationship between stars and dust |
| Webb: near-infrared | Stellar populations and regions less blocked by dust than in visible light | Some of the contrast that makes dust look completely black | Stellar structure in dusty environments and star formation |
| Webb: mid-infrared with MIRI | Dust emission and structures associated with star-forming regions | Many ordinary stars can become less prominent relative to glowing dust | Dust distribution, structure, motion, and composition when combined with other data |
The table is not an absolute rule for every image. Specific filters, exposure time, resolution, processing, and data combinations change what receives the most visual emphasis. The point is that each band responds differently to the same physical components.
Why the colors are not what human eyes would see
Much of the light observed by Webb is invisible to human eyes. To create a color image, data recorded through different filters are mapped into visible colors. In general, relatively shorter wavelengths are assigned bluer hues and longer wavelengths redder hues, but the final choices also aim to preserve contrast and scientific information.
Therefore, the red used to represent dust in the M64 view does not mean a person near the galaxy would see it that color. The color is a visual translation of infrared data. The scientific value lies in the relative distribution of the emission and in how it relates to stars, gas, and structures observed at other wavelengths.
M64's counter-rotation adds context to the dust and star map
M64 is also important because of its unusual dynamics. According to NASA, gas in the galaxy's outer regions rotates in the opposite direction from gas and stars in the inner regions. Where those flows meet, gas can be compressed, encouraging the formation of new stars.
One proposed explanation for the counter-rotation is a merger between M64 and a satellite galaxy more than a billion years ago. NASA describes this merger as a likely or possible explanation for the opposing motion, not something that can be demonstrated from the appearance of a photograph alone. The interpretation is supported by the gas dynamics and the galaxy's history of study.
The multiwavelength image matters in this context because dust and star-forming regions help map where interstellar material is concentrated. Even so, motion requires kinematic data, and detailed composition requires spectroscopic measurements. An image, however informative, does not replace those observations.
How to read a Hubble and Webb comparison without shortcuts
- Start with the observed wavelength. Before interpreting a color or dark region, check whether the data come from ultraviolet, visible, near-infrared, or mid-infrared light.
- Separate absorption from emission. A dust lane may look dark because it blocks background light and may look bright in another band because the dust itself emits in the infrared.
- Watch how contrast changes. Young stars, gas clouds, and dust do not keep the same appearance at every wavelength. Something that vanishes from one image can still be physically present.
- Do not turn color into a standalone diagnosis. Colors in astronomical images are filter mappings. To infer temperature, composition, or motion, researchers combine imaging with photometry, spectroscopy, and other data.
The value of the 2026 view is comparison, not replacement
Webb's view does not make Hubble images obsolete. The scientific gain comes from combining complementary information about the same galaxy. Hubble provides high-resolution ultraviolet, visible, and near-infrared data; Webb extends the near-infrared view and adds mid-infrared sensitivity to dust structures and obscured regions.
In M64, that combination turns the famous black eye into something more informative than a silhouette. The dust lane is no longer only material that hides the nucleus; it becomes part of what scientists want to measure. That change in perspective makes the Black Eye Galaxy a clear example of how modern astronomy builds a physical picture from multiple windows on the electromagnetic spectrum.