PISA 2025 science Level 2 marks the point at which a student begins to use scientific knowledge functionally rather than merely recognize isolated information. In the Brazil country note, the OECD summarizes this level by saying that students can recognize correct explanations for familiar scientific phenomena and, in simple cases, decide whether a conclusion is valid based on the data provided.
In the results released on 8 September 2026, 48% of students in Brazil reached Level 2 or higher in science, compared with 74% across OECD countries on average. Science was the main domain in PISA 2025. The three situations below are original study examples — they are not taken from PISA items — and show how this kind of reasoning can work.
What PISA 2025 science Level 2 requires
On the PISA 2025 science scale, Level 2 starts at 410 points. The OECD treats it as a baseline proficiency level: this is where students move from simply recognizing scientific ideas to using science in basic explanation, interpretation and evaluation tasks.
Skills described by the OECD at this level include:
- distinguishing an appropriate scientific explanation from a non-scientific one;
- giving a simple explanation for a familiar everyday phenomenon;
- interpreting straightforward relationships in data, including noticing an outlier;
- identifying evidence in a graph or table that supports a claim;
- evaluating simple aspects of an investigation and using one basic criterion to judge source credibility.
This does not mean mastering advanced content or solving every science problem. The core skill is linking a claim to the available evidence and avoiding conclusions that go beyond what the data can support.
A short method for testing a conclusion
- Read the question before the numbers. Identify exactly what needs to be compared.
- Find the relevant evidence. Not every value in a table is needed for the answer.
- Compare the conclusion with what was observed. Look for direct support in values, trends or differences.
- Check for overstatement. Words such as “always”, “causes”, “proves” or “in every situation” require stronger evidence.
The data in the examples below are hypothetical and were created to practise this process.
Example 1: plant growth under three light conditions
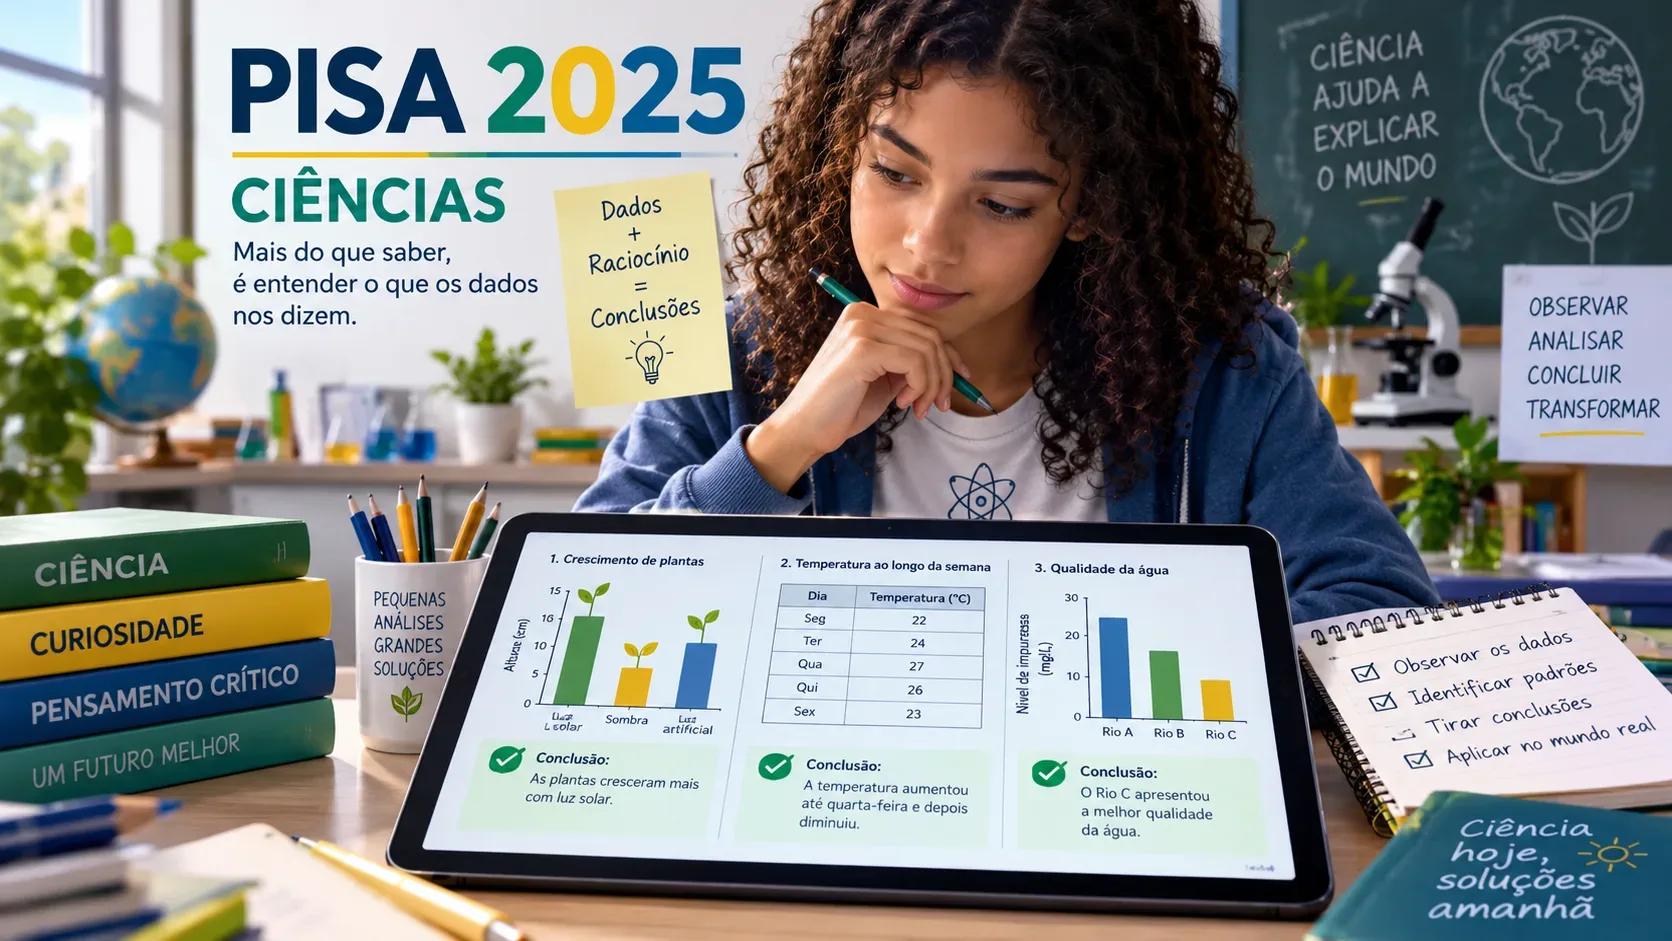
Three groups of seedlings of the same species were followed for 14 days. The table shows average growth during the period.
| Condition | Average growth |
|---|---|
| Sunlight | 7.2 cm |
| Artificial light | 5.1 cm |
| Shade | 2.9 cm |
Conclusion supported by the data
“In this experiment, seedlings exposed to sunlight grew more on average than seedlings kept in shade.” The conclusion matches the table: 7.2 cm is greater than 2.9 cm, and the statement limits its scope to the observed experiment.
Conclusion not supported by the data
“Sunlight is always the best condition for every plant.” The table does not justify this generalization. There is only one species, a short observation period and three specific conditions. The data support a local comparison, not a universal rule.
Example 2: water temperature after the heat source is removed
A container of water was taken away from a heat source, and its temperature was measured every five minutes.
| Time after removal from heat | Temperature |
|---|---|
| 0 min | 80 °C |
| 5 min | 68 °C |
| 10 min | 59 °C |
| 15 min | 52 °C |
| 20 min | 47 °C |
Conclusion supported by the data
“The temperature decreased during the 20 minutes observed.” Every successive reading is lower than the previous one. The conclusion describes a trend that is directly visible in the data.
Conclusion not supported by the data
“The water will keep cooling at the same rate indefinitely.” The table covers only 20 minutes, and the drops are not exactly the same size. Extending the same behaviour to any future time would require additional evidence and an appropriate model.
Example 3: testing a filter for reducing turbidity
In three trials, a water sample was measured before and after passing through the same filter. Lower values indicate lower turbidity.
| Trial | Before filtering | After filtering |
|---|---|---|
| 1 | 18 units | 8 units |
| 2 | 17 units | 7 units |
| 3 | 19 units | 9 units |
Conclusion supported by the data
“In all three trials, measured turbidity was lower after filtering.” The statement can be checked row by row: 8 is lower than 18, 7 is lower than 17, and 9 is lower than 19.
Conclusion not supported by the data
“The filter makes any water safe to drink.” Turbidity is only one measure. The table says nothing about microorganisms, chemicals or other drinking-water criteria. The conclusion therefore adds a claim that was not measured.
What the three examples teach about Level 2
In all three cases, the most important part is not a difficult calculation. It is controlling the scope of the conclusion. A sound answer must connect the question, the relevant data and a statement that does not say more than the evidence allows.
- In the plant example, the comparison is valid for the experiment but not for every species.
- In the temperature example, the observed trend is clear but does not justify an indefinite forecast.
- In the filter example, the measured indicator improves but is not enough to establish drinking-water safety.
This matches the PISA 2025 Level 2 description: interpreting simple data, identifying evidence that supports a claim and using basic scientific knowledge in familiar situations.
How to interpret Brazil’s result
The OECD country note for Brazil reports that 48% of students reached Level 2 or higher in science, compared with an OECD average of 74%. The Inep release also reports a Brazilian average of 409 points in science and notes that science had the broadest item coverage in 2025.
A country’s average score and the share of students at each proficiency level answer different questions. The average summarizes performance across the whole group, while the Level 2-or-higher percentage shows how many students reached at least that descriptive threshold. Level 2 should therefore not be treated as an individual school “passing grade”.
How to practise this reasoning without memorizing answers
- Use short tables and ask one precise question about what the numbers show.
- Write two conclusions: one strictly supported by the data and one intentionally overstated.
- Underline the exact evidence in the data set that justifies the correct conclusion.
- Ask what was not measured before accepting claims about cause, safety, effectiveness or universality.
For the official descriptors and context, see the OECD chapter on student performance in PISA 2025, the Brazil country note and the Inep release. Those sources explain the proficiency level; the three exercises in this article are original teaching examples.