
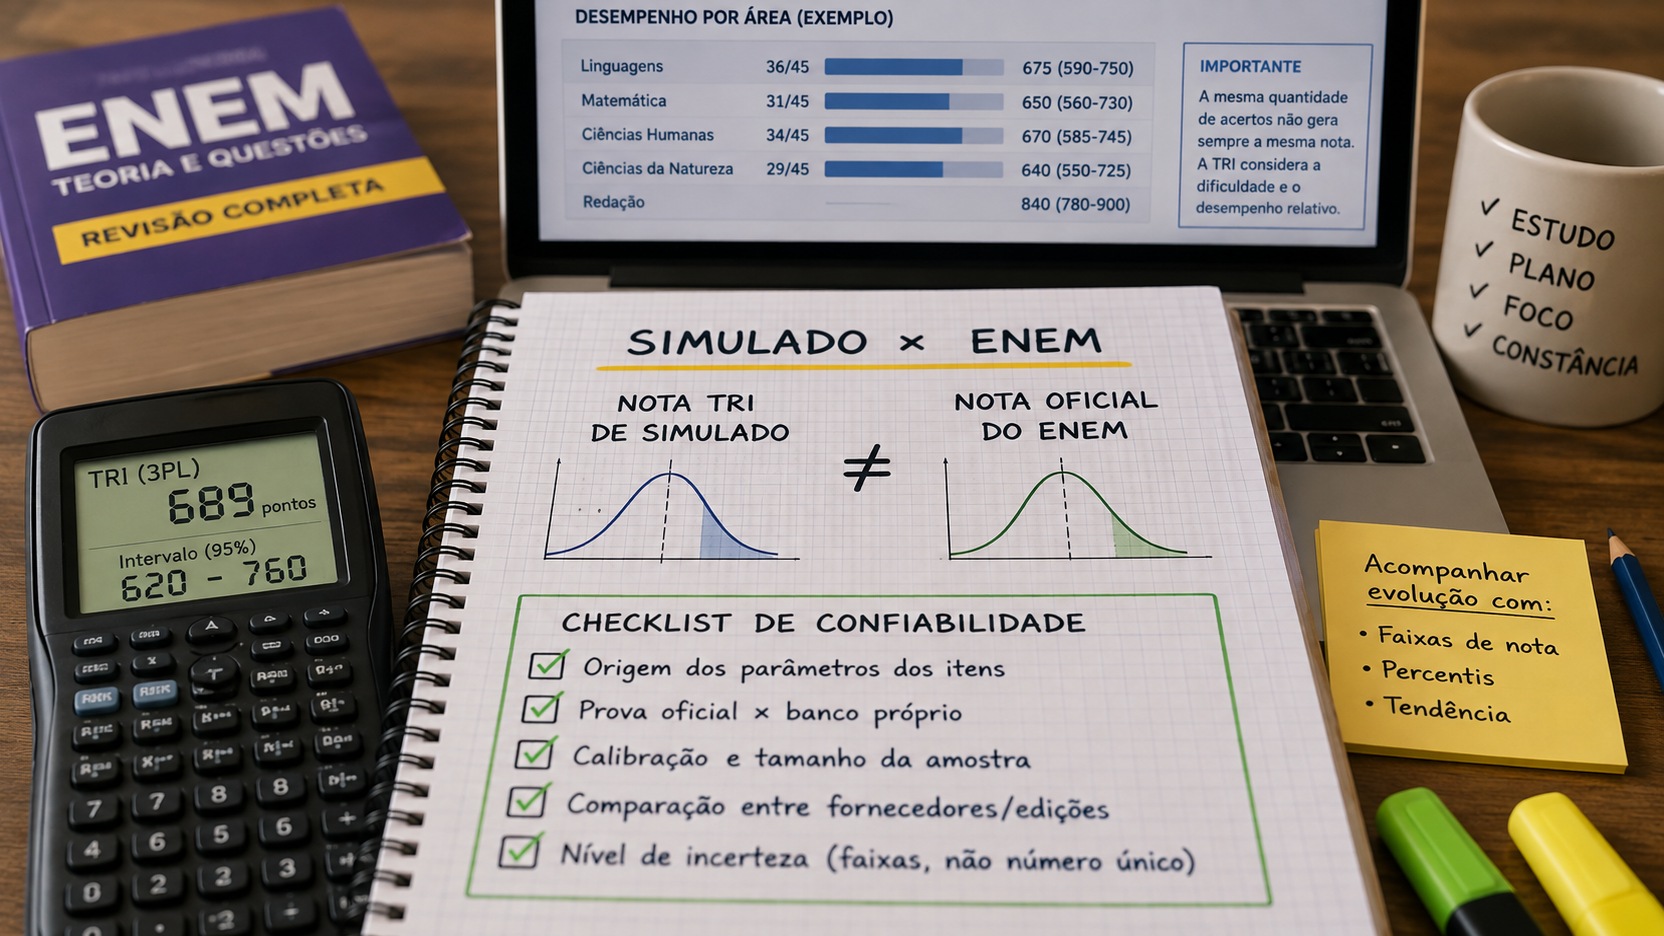
The short answer is: a TRI test score can be useful, but it should not be read automatically like the score you would get on the Enem. The value is more reliable when the simulation uses well-calibrated items, a scale comparable to that of the exam and a documented estimation method. When these elements are not known, the note works better as a trend indicator than as a point forecast.
Care is important because Item Response Theory does not simply transform a number of hits into a fixed number. Inep itself informs that the proficiencies of the Enem objective tests are calculated based on the TRI. In institute materials, the logic is explained by three characteristics of the items: discrimination, difficulty and probability of a random hit. This helps you understand why two people with the same number of correct answers can end up with different grades.
The TRI score in the simulation is not, by definition, the Enem score
Two platforms can write "TRI" on the screen and still produce numbers that are not directly comparable. The name of the model does not guarantee that the items have been calibrated on the same scale, that the question bank has the same composition as the Enem or that the final transformation to the displayed scale follows the same procedure.
In Enem, the grade is produced within an assessment system built for that exam. The items go through elaboration, pre-test and analysis processes. Inep has already explained that the pre-test is carried out with a population similar to the one that will carry out the assessment and that the results serve to calibrate the items. This detail is central: it is not enough to informally classify a question as easy, medium or difficult and assign a weight.
Therefore, a calculator that only receives the total number of hits and returns a single number is making an approximation. It can use historical data and produce a useful reference, but it loses information about which items were answered correctly and the pattern of responses that the IRT considers. The less information that goes into the calculation, the greater the caution with the precision presented.
What makes an IRT estimate more reliable
Where do item parameters come from?
This is the first point to check. In the three-parameter model used as a reference in Inep materials, each item has parameters linked to discrimination, difficulty and chance accuracy. If the simulation uses official questions from a past edition and works with item information released by Inep, there is a more auditable basis than in a generic conversion of correct answers to points.
This still does not mean that any tool will reproduce the official note exactly. It is necessary to know how proficiency is estimated, how canceled items or adaptations are treated and how the final scale is constructed. The presence of official parameters increases transparency, but does not eliminate the need for a coherent methodology.
When the bank is owned, the question changes: how were these items calibrated? A private bank can use TRI in a technically serious way, but needs to have sufficient application data, adequate sample and calibration procedure. If the platform doesn't explain anything about this, you have no way of distinguishing a psychometric estimate from an internal rule that just imitates the appearance of the Enem scale.
Does the test use official items or its own bench?
A simulation made up of questions from previous editions of Enem has a traceability advantage: you know the origin of the items and can check tests, templates and information published by Inep. A proprietary database may be better for measuring new content and avoiding memorization, but it requires its own evidence of quality.
The mistake is to imagine that "Enem-style question" automatically equates to "item on the Enem scale". Pedagogical style and statistical calibration are different things. A question may appear very similar to the official ones and yet not have estimated parameters in a compatible population.
Was there calibration with a suitable sample?
TRI depends on response data. To estimate parameters of an item with quality, it is necessary to observe how people with different levels of proficiency respond to it. Sample size matters, but it is not the only point. It also matters who makes up this sample and whether it resembles the audience for which the measure will be used.
This explains why a platform can have many users and still produce a biased scale towards a specific group. A very selective course, for example, may bring together participants with a different profile than the national group. The estimate may remain useful within that environment, but should not be treated as interchangeable with an official grade without a scale-linking procedure.
Is the scale really comparable between trials and suppliers?
This is one of the points that generate the most confusion. Two tests can use TRI and still be on different scales. If each vendor calibrates their bank separately and then presents a score between 0 and 1000, the fact that they both show "680" does not prove that they measured the same level of proficiency.
To compare numbers between different instruments, some type of link between scales is necessary, with reference items, compatible parameters or other documented psychometric procedure. Without this, the safest comparison is longitudinal within the same system: same
platform, stable methodology, evidence of similar structure and interpretation of results as a trend.
Does the tool show uncertainty or feign precision?
A proficiency estimate is not an error-free measurement. The smaller or less informative the set of items, the greater the uncertainty tends to be. Therefore, a range is often more honest than a number presented as if it were exact.
If a calculator reports 689 points, for example, it's worth asking what that 689 means. Is it a historical median? An estimate based on the pattern of responses? A regression based on the total number of correct answers? Is there standard error or range? Without this explanation, decimal places or the appearance of precision may convey more confidence than the method allows.
Why the same number of correct answers does not generate a single score
Imagine two students with 30 correct answers in Mathematics. One got most of the easy and medium items right and also some difficult ones. The other got several questions wrong which, due to the behavior observed during calibration, are more accessible and got a sequence of more difficult items right. The two have the same total, but the response patterns carry different information to the model.
This does not mean that TRI automatically "punishes" anyone who gets an easy question wrong, nor does it mean that there is a secret fixed weight for each item. Proficiency is estimated considering the set of responses and the statistical characteristics of the items. The idea of coherence helps to explain the phenomenon, but it must be understood as the model's behavior, not as a simple rule like "you made an easy mistake, lost so many points".
Enem 2025 microdata, made available by Inep, makes it possible to study this effect with official data because it brings together tests, answer sheets, information about items and grades, among other variables. Instead of looking for a table like "30 correct answers = 700 points", a better analysis groups participants with the same number of correct answers in an area and observes the distribution of the marks obtained.
The useful result of this type of query is not a magic number. It is a range: for example, median and percentiles, in addition to the range observed after excluding situations that are not comparable. The objective is to visualize that the same total number of correct answers can occupy more than one point on the scale. The width of this distribution is precisely what a simple conversion of hits tends to hide.
How to use microdata without creating a false grade promise
Official microdata is great for building historical references, but it also needs to be interpreted with care. An edition of Enem has its own composition of items, and distributions from a past test are not a promise for the next one. They show what happened in that group of participants and on that instrument.
To transform the data into a study reference, a prudent approach is to separate by area, count the correct answers of each participant in the analyzed edition and, for each total number of correct answers, summarize the distribution of scores. Instead of publishing just the average, it is better to look at the median and percentiles such as 25th and 75th, or 10th and 90th when the sample is large. This makes the degree of variation explicit.
The correct reading would be: "in a past edition, participants with this total number of correct answers occupied this range of scores". The incorrect reading would be: "if I make this total, my grade will be that". The first statement describes data; the second transforms a historical distribution into a deterministic individual forecast.
What metrics to use to track your progress
Area hits remain the most transparent measure
To monitor the study week by week, the number of correct answers in each area is a simple, verifiable metric that is not dependent on the supplier. It does not replace the TRI, but it helps you know if you are solving more items correctly.
Avoid adding the four areas and treating the overall total as if they were all a single test. Enem calculates proficiencies by area, and the composition of each area is different. It is more useful to follow Languages, Humanities, Nature and Mathematics separately.
Use the estimated score as range and trend
If the simulation offers a TRI estimate, record the range or range reported, not just the center point. When comparing mockups from the same vendor, note whether the center and range shift consistently across multiple applications. An isolated increase may reflect more favorable evidence; a repeated trend is more informative.
When the platform only delivers one number, treat it as an internal index until the methodology proves external comparability. This reduces the temptation to interpret a small difference, such as 15 or 20 points, as real progress without considering instrument uncertainty.
Compare percentile only within the same reference group
Percentile answers a different question than the grade: it shows your position in relation to the group that made that assessment. It can be useful in large simulations, but it only makes sense to know who makes up this group. The percentile of an open national platform and the percentile of a high-performing class are not equivalent.
The same goes for comparing editions. If the audience changes a lot, the relative position may rise or fall without your proficiency changing in the same proportion. Use percentile as a complement, not as a substitute for correct answers and proficiency estimation.
Track the pattern of errors, not just the score
To decide what to study, the grade is insufficient. Record which skills and item types continue to generate an error, especially when the problem recurs across different trials. Real evolution appears when you start to answer new questions of the same type, not just when you memorize the correction of a previous test.
If the platform classifies difficulty based on parameters or hit rate, this information can help separate basic errors from more advanced gaps. But check out how the difficulty was defined. "Difficult" could mean high TRI parameter, low hit rate in the group or just an editorial rating from the supplier.
Can I compare the score of one test with another?
The comparison is stronger when the two applications belong to the same system, use a stable methodology and have a similar structure. Even so, prefer to look at a series of results, not a specific difference.
Among different providers, first compare the metrics that require the least assumptions: correct answers by area, test time, blank questions and performance by content. If both present
note TRI, only treat numbers as equivalent when there is a clear explanation of how the scales were linked to the Enem reference.
If one supplier uses official parameters from past tests and another uses its own calibrated database, both can produce useful estimates, but through different paths. The final number should not be treated as a universal unit just because it appears in a numerical range similar to that used in Enem estimates.
What about a goal like 700 points?
Goals are useful, but the question "how many hits do I need for 700?" There is no single answer that applies to all areas, issues and response patterns. A better way to use historical data is to look for the distribution of scores among participants with totals close to their target and observe where in that distribution 700 appears.
This turns the goal into a safety range. If, in historical data, a certain hit total appears both below and above 700, you know you are in a zone of uncertainty and need to increase the margin. If slightly larger totals concentrate most of the distribution above the target, they provide a more conservative benchmark for planning.
Still, this is a historical reference, not a guarantee. The future test will have other items and another composition. The goal is to make better study decisions, not predict an official grade before it exists.
Final checklist to trust more - or less - in the simulation IRT
Does the supplier explain the origin of items and parameters?
If yes, you can assess whether the score comes from official data, from a calibrated bank or from a statistical conversion of correct answers. The more traceable the origin, the greater the possibility of auditing.
Is there information about calibration and sampling?
A minimum description of population, volume of responses and calibration method shows that the platform recognizes that the quality of the measurement depends on the data used to construct the scale.
Is the note accompanied by a band, error or distribution?
Sashes communicate uncertainty more honestly. A single number may be practical, but it should not hide that estimated proficiency varies with the instrument and response pattern.
Is it possible to compare editions from the platform itself in a consistent way?
For personal monitoring, internal consistency is more important than the promise of getting the future Enem score exactly right. If the method changes with each edition, the historical series loses value.
Does the platform avoid promising official equivalence?
A responsible tool differentiates estimates from official results. The real Enem score is the one calculated by Inep based on the answers to the edition carried out. Any previous or external value should be treated as a reference, not a replacement.
The rule of thumb for not making mistakes with your grade
Use the IRT from the simulation to answer “Is my trend improving?” and "what range am I likely to be in within this method?" Don't use the number to say "this is the grade I would get today in Enem" without knowing the methodology and uncertainty.
To monitor progress, combine hits by area, estimated grade range, method consistency between applications and error analysis. To compare suppliers, be wary of automatic equivalences and look for evidence of calibration and scale linkage. And, when using official Inep data to convert hits into references, preserve the distribution: the track tells the story that a single number erases.