
The best prompt for analyzing a spreadsheet in ChatGPT does not begin with “find insights.” It begins by imposing an order of work: first understand the structure, then diagnose problems, next propose the plan, and only then calculate and validate. That sequence reduces a common risk in AI-assisted analysis: receiving a convincing-looking conclusion without knowing which sheets, filters, formulas, exclusions, or assumptions produced it.
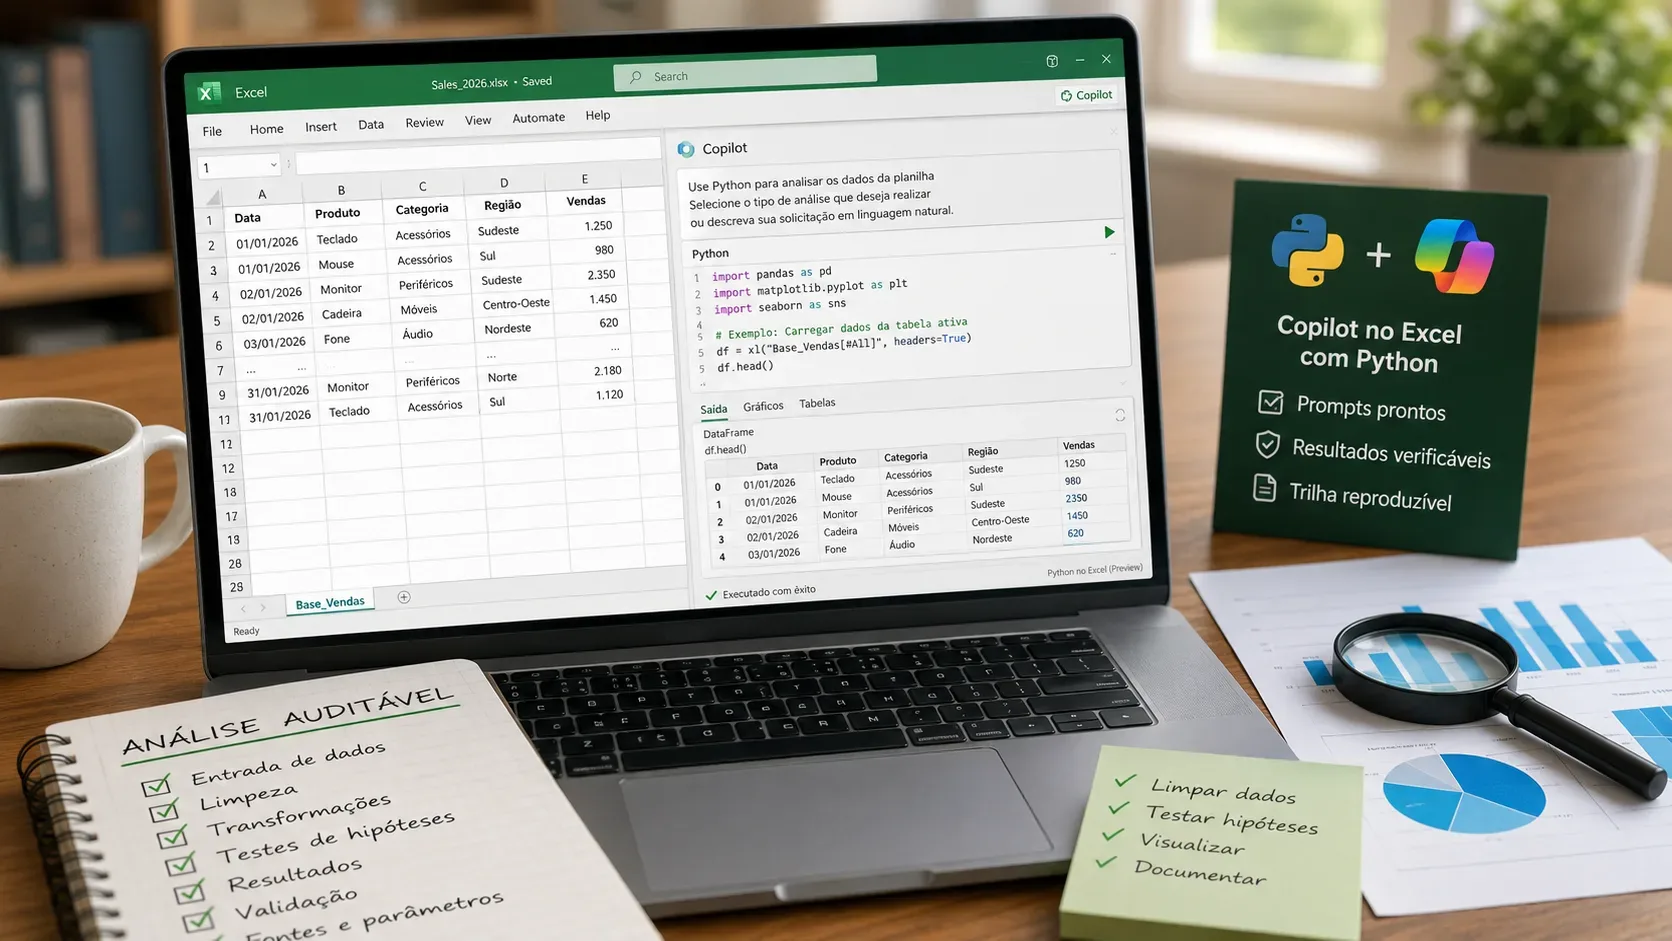
OpenAI's current documentation supports that caution. ChatGPT can analyze .xls, .xlsx, and .csv files, create tables and charts, and run Python-based calculations, transformations, and statistical analysis. At the same time, the documentation recommends reviewing code, outputs, and assumptions. In ChatGPT for Excel and Google Sheets, which is in beta and described as globally available in the documentation checked on August 31, 2026, users are advised to be explicit about what must be preserved, ask for a plan before large edits, and review formulas, calculations, citations, and changed cells before relying on the result.
Ready-to-use prompt: spreadsheet analysis with diagnosis, validation, and traceability
Upload the spreadsheet or CSV and paste the prompt below. Change only the text in brackets if you want to specify a particular question.
Act as a data analyst responsible for an auditable and reproducible analysis of this spreadsheet/CSV.
Main objective: [describe the business question or write “determine what the data can support with confidence”].
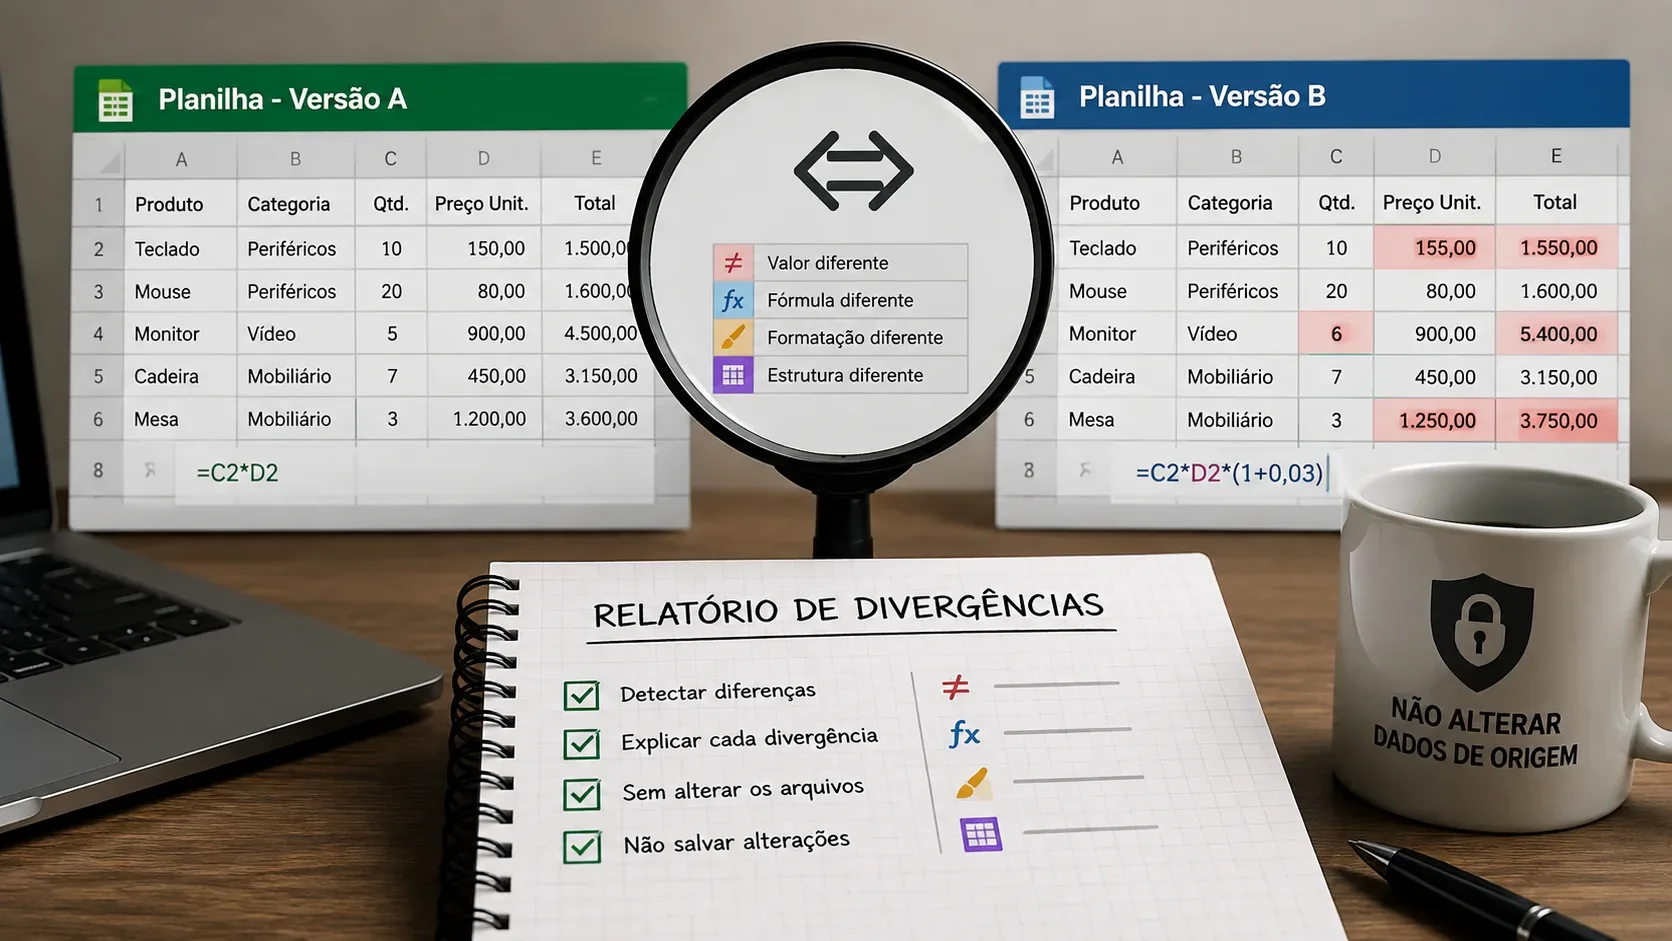
Operating rule: start in read-only mode. Do not alter, overwrite, clean, fill, delete, recode, or reorder source data without my explicit approval. When you need to transform data for analysis, use a derived copy, DataFrame, new sheet, or output file and preserve the original.
1. Inventory the data before analyzing it. List available files and sheets; approximate dimensions; column names; apparent data types; possible keys or identifiers; the grain of each table; date range; units; relevant formulas; number of blanks; apparent duplicates; and possible relationships between sheets. If one sheet contains multiple tables, identify them separately.
2. Diagnose quality without fixing anything yet. Look for missing values, duplicates, incompatible types, invalid dates, inconsistently spelled categories, outliers, impossible values, broken formulas, suspicious totals, subtotal rows mixed with detail rows, and changes in units or scale. Clearly separate “observed problem,” “hypothesis,” and “possible impact.” Do not repair anything at this stage.
3. Define what will be answered. Restate the analytical question in one sentence. If the objective is ambiguous, list the possible interpretations and choose only what the data can support, marking uncertainty explicitly.
4. Propose the plan before any edit. Show the sequence of analyses, metrics, filters, groupings, joins, transformations, and charts you intend to use. For every important calculation, identify source columns, formula or method, denominator, and missing-value treatment. If any step requires changing the workbook, stop and ask for approval before making that change.
5. Execute the analysis non-destructively first. Preserve source data. Record row counts before and after filters, joins, and removals in the derived copy. Document every exclusion, and never discard outliers merely because they look unusual; investigate them and, when relevant, show the effect of including and excluding them.
6. Maintain traceability for results. For every key number, report the source sheet/table, columns used, filters applied, formula or code, period, unit, and denominator. If you use Python, show the relevant code or describe the operations precisely enough for another person to repeat them.
7. Perform validation and sanity checks. Reconcile totals with subtotals when available; compare equivalent calculations through independent paths when possible; verify units, signs, dates, percentages, and decimal places; test extreme values; inspect sample rows supporting the conclusions; and flag results that change substantially with small changes in filters or assumptions.
8. Deliver a reproducible report. Organize the answer as: (a) executive summary; (b) data inventory; (c) data-quality issues; (d) methodology; (e) results with tables; (f) anomalies and exceptions; (g) assumptions and limitations; (h) sanity checks performed; (i) exact steps to reproduce the analysis; and (j) questions the data still cannot answer.
9. Change the spreadsheet only if I approve it later. If I request corrections, make them in a copy, a new sheet, or an output file whenever possible. Produce a change log with location, previous value/state, new value/state, and reason. Do not silently replace the original. If the tool cannot guarantee a non-destructive change, stop and explain the limitation.
10. Before finishing, perform a final review. Confirm that the conclusion actually follows from the data, that no key calculation lacks an audit trail, that no assumption remains undeclared, and that a different person could reproduce the result from the same file.
Why this prompt is safer than “analyze this spreadsheet”
A generic request can still produce a useful answer, but it leaves methodological decisions implicit. The AI may choose a sheet, interpret a column, drop rows, group categories, or calculate an average without making clear that other equally plausible choices existed. The prompt above turns those choices into visible stages.
| Stage | Expected output | Warning sign |
|---|---|---|
| Inventory | Sheets, columns, types, keys, grain, and period | Analysis starts before mapping the file |
| Diagnosis | Blanks, duplicates, errors, outliers, and inconsistencies | Problems are “fixed” before being quantified |
| Plan | Metrics, filters, formulas, joins, and denominators | The method is hidden behind a finished answer |
| Execution | Calculations on a derived copy and before/after counts | The original is modified to make analysis easier |
| Validation | Reconciliations, samples, unit checks, and sensitivity tests | No independent check of the main numbers |
| Report | Result, method, limitations, and reproduction steps | The conclusion has no audit trail |
What it means to inventory a spreadsheet schema
Schema, in this context, is the operating map of the data. Listing column names is not enough. The analysis needs to determine what each row represents, which fields may identify records, how sheets relate to one another, whether a column is in dollars or thousands of dollars, whether a date refers to a sale or a payment, and whether totals are mixed with detailed records.
This inventory is especially important in inherited workbooks, multi-sheet files, and CSV exports from other systems. Two columns called “value” may mean different things; a seemingly duplicated row may be a second installment; and a blank date may mean “not completed,” not merely “missing data.” The prompt makes ChatGPT surface those ambiguities before treating them as facts.
Diagnosis is not automatic cleaning
Detecting a problem and correcting it are different decisions. If “New York,” “NY,” and “N.Y.” appear in the same column, the inconsistency is observable. Consolidating them into one category may be reasonable, but it is already a transformation. In an auditable analysis, that transformation should be proposed, justified, and logged.
The same applies to missing values and outliers. Replacing a blank with a mean, zero, or last known value can change the conclusion. Excluding a very large sale because it “looks like an error” may remove the most important event in the period. The prompt requires the model to show the problem first and, when necessary, compare scenarios before and after the decision.
The plan should appear before the AI changes data
Official guidance for ChatGPT for Excel and Google Sheets recommends asking for a plan before large edits and being specific about what may or may not be changed. The same rule is useful when working in standard ChatGPT with an attached file: make the AI declare the method before executing the irreversible part.
A good plan does not merely say “I will analyze trends.” It says, for example: “I will filter orders with completed status, group by the month of the invoice date, sum net revenue, calculate unique customers by channel, and compare the result with the total on the Summary sheet.” That level of detail makes it possible to catch a wrong denominator before it contaminates the entire report.
Traceability: how to know where each number came from
For a result to be reproducible, another person must be able to reach the same number from the same file. Each important metric therefore needs a trail: sheet, columns, filters, formula, unit, period, and denominator. When Python code is used, OpenAI's documentation advises reviewing code, outputs, and assumptions; asking for the relevant code or an exact description of the operations reduces dependence on a purely narrative explanation.
This also helps separate three things that are often mixed together:
- file fact: the value exists in a specific cell or row;
- calculated result: the value was produced by a sum, average, rate, join, or transformation;
- interpretation: the result suggests a cause, trend, or decision.
The more important the decision, the less these three layers should be blended.
Sanity checks: preventing an elegant but wrong analysis
A sanity check is a plausibility test. It does not prove by itself that a calculation is correct, but it can expose errors that a formally valid formula hides. If regional sales sum to far more than the overall total, a join may have duplicated rows. If a conversion rate exceeds 100%, numerator and denominator may belong to different populations. If monthly revenue changes by a factor of ten between columns, one may be in dollars and another in thousands.
The prompt forces the analysis to look for these inconsistencies through reconciliations, independent calculations, sample inspection, and sensitivity tests. It is a small step with a large effect on practical reliability.
How to adapt the prompt for Excel, CSV, and multi-sheet workbooks
For a simple CSV
Add the business question and ask the model to focus on data types, decimal separators, encoding, dates, and duplicates. Because CSV does not preserve formulas or multiple sheets, traceability should focus on columns, filters, and transformations.
For an Excel file with formulas
Explicitly request a map of key formulas, dependencies, and input cells before any correction. If the analysis identifies a broken formula, ask first for an explanation of the reference chain and estimated impact; the fix comes afterward.
For a workbook with multiple sheets
Require the model to identify each sheet's role and the keys used to relate them. A bad join can silently multiply rows. Ask for row counts before and after every merge and for uniqueness tests on the join keys.
For recurring analysis
Ask the report to end with a “reproduction recipe”: input file, sheets used, filters, transformations, formulas, code, order of operations, and checks. Then the next month's update does not depend on the memory of the conversation.
What ChatGPT can do — and what still needs human review
According to OpenAI's official data-analysis documentation, ChatGPT can inspect files, summarize rows and columns, identify trends and outliers, create tables and charts, and run calculations and transformations with Python. The same documentation notes that the method chosen may not match the user's intent on the first attempt and advises reviewing code, outputs, and assumptions.
In the spreadsheet-native Excel and Google Sheets experience, OpenAI also warns that outputs may be incomplete or incorrect and recommends reviewing formulas, calculations, citations, and changed cells. For important work, it advises duplicating the file so changes can be reversed. Using AI therefore does not remove controls; it changes where those controls need to appear.
Checklist for accepting or rejecting the analysis
- Did the model describe every relevant sheet or table before drawing conclusions?
- Did it explain what each row represents and which columns act as keys?
- Did it quantify blanks, duplicates, and inconsistencies before fixing them?
- Did it explain filters, formulas, denominators, and exception handling?
- Did it preserve the original file or work on a derived copy?
- Did it show row counts before and after filters and joins?
- Could it reconcile the main totals?
- Did it perform at least one independent check of critical numbers?
- Did it separate file facts, calculations, and interpretations?
- Did it record limitations and questions the data cannot answer?
- Did it leave enough instructions to reproduce the analysis?
A safe prompt does not stop the AI from working; it makes the work verifiable
The advantage of this prompt is not that it makes ChatGPT “unable to make mistakes.” No prompt can guarantee that. The benefit is that it forces the analysis to leave a trail: first the data map, then the problems, then the method, then the calculations, and finally the checks. If something is wrong, you can locate the stage where the decision was made.
For high-impact analysis, keep a copy of the original file, review critical formulas and calculations, and validate results against an independent source when one exists. The goal is to use AI's speed without giving up control, context, or reproducibility.