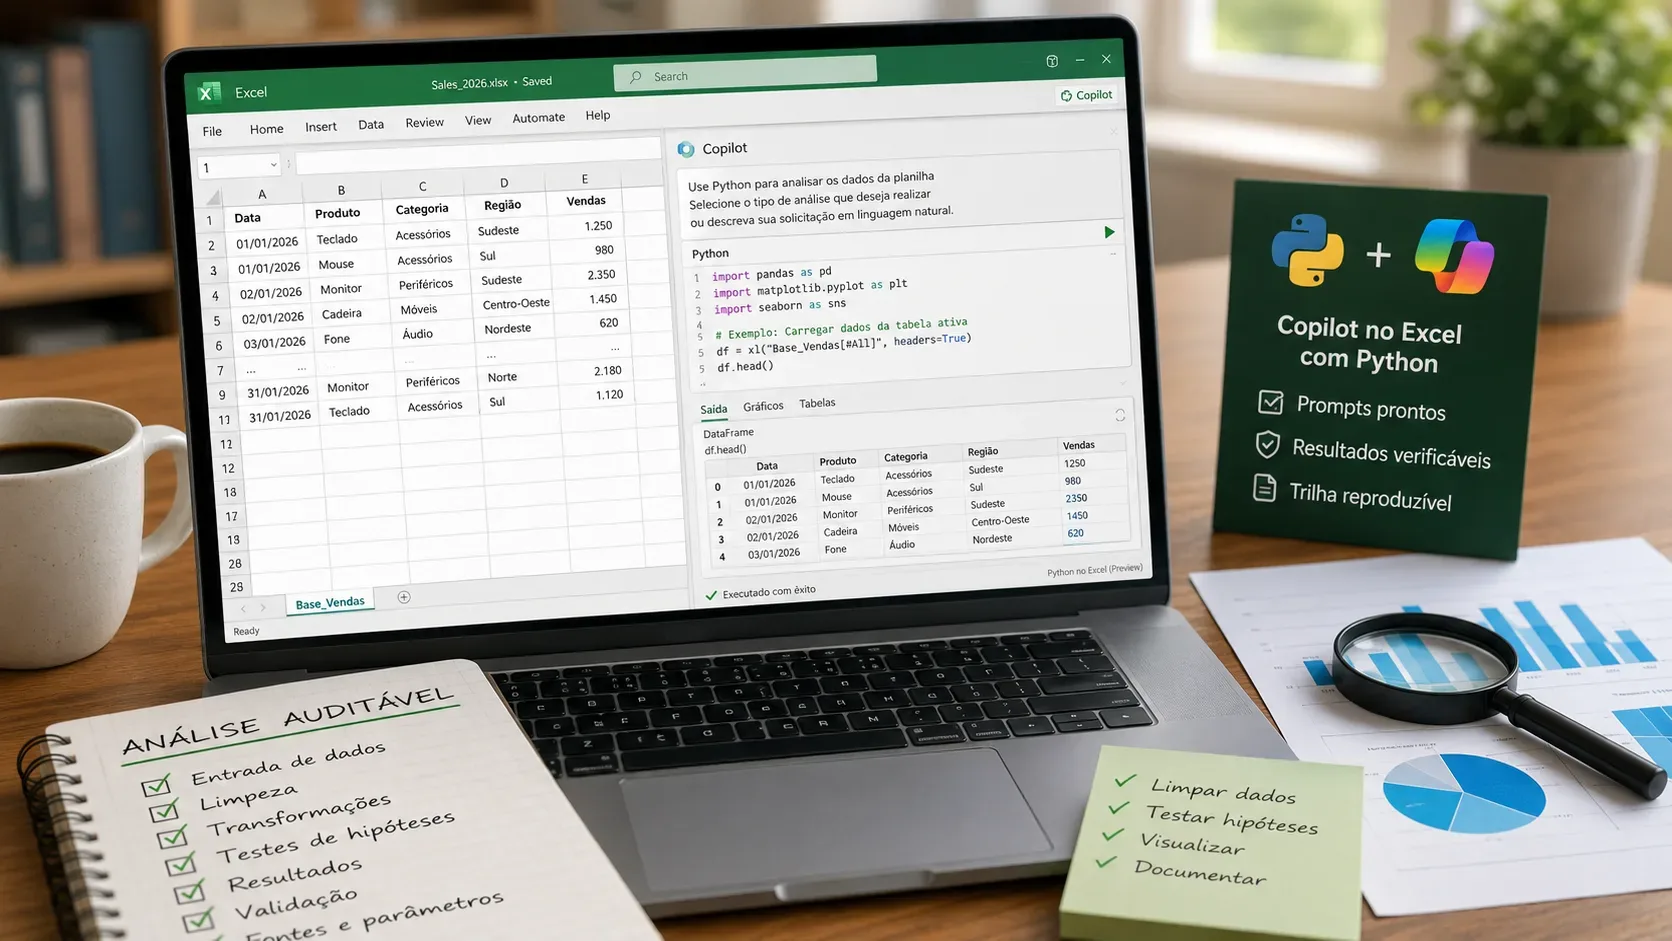
Since August 25, 2026, Microsoft has stated in the Microsoft 365 Copilot release notes that Edit with Copilot in Excel can execute Python for advanced analysis, automation, and data transformation, with results returned directly to the workbook. This expands the range of tasks beyond a single formula to statistics, simulations, and advanced visualizations. The value, however, depends heavily on the prompt: the more explicit the inputs, checks, and expected outputs are, the easier the work is to review.
This guide provides ready-to-use prompts for three recurring needs: cleaning data without losing traceability, testing hypotheses with assumptions and effect measures, and producing an auditable analysis. Adapt the placeholders to the actual names of your tables, worksheets, and columns.
Before you start: what Copilot and Python in Excel can do
In the Microsoft 365 Copilot release notes, Microsoft says Edit with Copilot can use Python on Windows, Mac, and the web for statistics, simulations, advanced visualizations, automation, and data transformation. Microsoft also suggests opening a workbook with data, entering Edit with Copilot, and asking for a task such as summarizing trends, cleaning data, or creating a visualization with Python.
Python in Excel runs code in the Microsoft Cloud and returns results to the worksheet. The default libraries include pandas, NumPy, Matplotlib, seaborn, and statsmodels, according to the library documentation. Internet access is required.
One limitation matters for auditability: Python in Excel runs in an isolated container without network access or access to your computer or local files. It can access data referenced from the workbook. This reduces the chance that a script silently pulls in external data during the analysis, but it does not remove the need to review inputs, transformations, and conclusions. Microsoft also warns that AI-generated results can be wrong or misinterpreted.
The minimum structure of a good prompt
To turn a generic request into a verifiable analysis, include five blocks:
- Input: worksheet, table or range, and the columns that may be used.
- Objective: the question the analysis must answer.
- Constraints: what must not be changed, imputed, or discarded without justification.
- Checks: data types, missing values, duplicates, outliers, statistical assumptions, or consistency checks.
- Output: where to record cleaned data, metrics, charts, Python cells/code, and a decision trail.
If the source data matters, use a simple rule: do not overwrite it. Ask Copilot to work in a new worksheet or table and keep a transformation log so the before-and-after states can be reconciled.
Prompt 1: diagnose data quality before cleaning
Use Python to audit the table [TABLE_NAME] on the worksheet [SHEET]. Do not change the data yet. Use the columns [COLUMN_LIST]. Produce a diagnostic with: row and column counts; detected data types; count and percentage of missing values by column; exact duplicates; unique values in categorical columns; minimum, maximum, mean, median, and quartiles for numeric columns; dates outside the expected range [RANGE, IF ANY]; and possible outliers using the IQR method, without removing them. Create a new worksheet named Data_Audit with the checks and flag each issue with the column, issue type, number of occurrences, and an example. Do not modify the original table. At the end, summarize which problems are objective and which require a business decision before cleaning.
When to use it: before any transformation. The prompt separates diagnosis from correction and reduces the risk of “cleaning” an exception that is actually valid.
Prompt 2: clean data with explicit rules and a transformation log
Use Python to create a clean version of the table [TABLE_NAME] without overwriting the original. Apply only these rules: [RULE 1], [RULE 2], [RULE 3]. Before each transformation, count how many rows will be affected. Do not delete rows because of missing values or outliers unless one of the rules above explicitly requires it. Standardize text without changing meaning, convert types only when the conversion is safe, and preserve the identifier column [ID] unchanged. Write the result to a new worksheet named Clean_Data. In another worksheet, Cleaning_Log, record step, rule, column, affected rows, before/after counts, and any value that could not be converted. Run a final reconciliation of total rows, unique keys, missing values, and key summary statistics between the source and cleaned data. If a rule causes unexpected data loss, stop and flag it.
Essential checkpoint: always request before/after counts and unique keys. A drop in rows or IDs is easy to spot and often exposes overly aggressive filters or deduplication.
Prompt 3: deduplicate without deleting legitimate records
Analyze possible duplicates in the table [TABLE_NAME] using the keys [KEY_1, KEY_2]. First separate: exact duplicates across all columns, duplicate keys with identical data, and duplicate keys with conflicts in other columns. Do not remove anything in the first step. Create a review table listing duplicate groups, record counts, and conflicting columns. Then apply only this tie-break rule: [RULE, FOR EXAMPLE: keep the record with the most recent update_date]. Generate a Deduplicated version and a log showing removed IDs, kept ID, and reason. Validate that no key expected to be unique remains duplicated and report how many rows were removed.
Prompt 4: test a difference between two groups
Use Python to test whether [NUMERIC_VARIABLE] differs between the groups defined by [GROUP_COLUMN], comparing [GROUP_A] and [GROUP_B]. Use only the table [TABLE_NAME]. First check sample sizes, missing values, distribution, outliers, and a dispersion measure for each group. Choose the statistical test based on the data and explain why it is appropriate; do not automatically use a t-test if its assumptions are not reasonable. Report the test statistic, p-value, estimated difference between groups, a 95% confidence interval when applicable, and an effect-size measure. Use alpha = [0.05 OR OTHER]. Do not treat p < alpha as absolute proof: write the conclusion in evidence-based language. Create a Hypothesis_Test worksheet with inputs, assumptions, method, results, and conclusion. Keep the source data unchanged.
Why this is better than “run a t-test”: it forces the workflow to inspect the data and justify the method. It also asks for an effect size and confidence interval instead of relying on the p-value alone.
Prompt 5: compare proportions or conversion in an A/B test
In the table [TABLE_NAME], compare the rate of [BINARY_EVENT] between [GROUP_A] and [GROUP_B], identified by [GROUP_COLUMN]. Validate that each observation appears once using the key [ID]. Calculate each group size, number of successes, success rate, absolute difference in percentage points, and relative difference. Choose an appropriate test for two proportions and verify that the counts are sufficient for the approximation used. Report the statistic, p-value, and a 95% confidence interval for the difference. If the samples are small, use a suitable alternative and explain it. Create an auditable summary with the null hypothesis, alternative hypothesis, alpha, method, and interpretation. Do not confuse statistical significance with business impact.
Prompt 6: regression with assumption checks
Use Python to estimate the relationship between [TARGET_VARIABLE] and [PREDICTORS] in the table [TABLE_NAME]. Before modeling, report the number of valid rows, missing values, and any required encodings. Fit a [LINEAR/LOGISTIC, as appropriate] model and report coefficients, confidence intervals, fit metrics, and appropriate residual or classification diagnostics. Check multicollinearity when there are multiple predictors and flag influential observations. Do not automatically remove variables or outliers: present the diagnostic and, when useful, a separate sensitivity analysis. Create a Model_Analysis worksheet with model specification, sample used, results, and limitations.
Prompt 7: simulation with visible assumptions
Use Python to simulate [QUESTION, FOR EXAMPLE: monthly profit distribution] from the assumptions in the table [TABLE_NAME]. First list every variable, distribution, or rule you intend to use. Do not invent parameters: if an assumption is not in the workbook, flag it before running. Run [N] simulations with a fixed seed [SEED] for reproducibility. Return percentiles [P5, P50, P95], mean, standard deviation, and the probability of [EVENT]. Create a distribution visualization and an Assumptions_Simulation table showing each input and its source. Record N and the seed in the output so the simulation can be rerun.
Prompt 8: create a visualization without hiding the numbers
Use Python to visualize [METRIC] by [DIMENSION/TIME] from the table [TABLE_NAME]. Before drawing the chart, generate the aggregated table that feeds the visualization and validate totals against the source. Choose the chart type based on the question; avoid a truncated axis when that could distort interpretation. Use an objective title and labels, and do not imply causality if the analysis is descriptive. Write the supporting table and visualization to the Visual_Analysis worksheet. Report every filter, grouping rule, or exclusion applied.
Prompt 9: produce an end-to-end auditable analysis
Create an auditable analysis for this question: [BUSINESS_QUESTION]. Use only [AUTHORIZED_TABLES/RANGES]. Do not overwrite source data. Organize the work into four outputs: 1) Analysis_Data, containing the version used after transformations; 2) Checks, containing data-quality and validation results; 3) Results, containing the required tables, tests, and charts; 4) Audit_Trail, containing analysis date/time, internal sources used, source tables/ranges, cleaning rules, filters, assumptions, statistical method, parameters, simulation seed if applicable, relevant Python cells or steps, and limitations. Before concluding, verify that totals and keys in the analyzed version can be reconciled to the source. Then write a short conclusion that clearly separates observed facts, statistical inferences, and claims that cannot be supported by the available data.
How to review Copilot's output
Even with a detailed prompt, review the work in layers. First confirm that Copilot used the correct table and columns. Then reconcile counts, totals, and identifiers to the source. Next review transformations and the assumptions behind the method. Only then read the interpretation.
For workbook edits, Excel includes change-history tools. Microsoft documents that Copilot can summarize changes available in the workbook history, while Excel lets you inspect them under Review > Show Changes; Version History can be used to recover a previous version. The change history does not necessarily capture every edit from every Excel version or feature, so it should be one layer of audit evidence rather than the only one.
Checklist for a verifiable analysis
- Are the data source and ranges clearly identified?
- Was the original dataset preserved?
- Were row counts and keys reconciled before and after cleaning?
- Were missing values, duplicates, and outliers handled by explicit rules?
- Was the statistical method justified and were its assumptions checked?
- Are confidence intervals and effect sizes included when relevant?
- Were simulation parameters, including the seed, recorded?
- Are the tables feeding the charts available for review?
- Are limitations and unsupported conclusions explicitly stated?
- Can the main steps be reconstructed from the workbook itself?
Practical and security limits
Python in Excel uses cloud execution and a curated set of libraries. Microsoft’s security documentation says the code has no network access, no access to the user’s computer or user token, and that data is not persisted in the execution container. Availability of Python in Excel and Copilot varies by platform, subscription, and organizational settings; Microsoft maintains a dedicated Python in Excel availability page.
Finally, treat Copilot as an assisted executor, not as the final judge of the analysis. Microsoft itself notes that AI-generated results can contain mistakes. For sensitive decisions, validate the methods, data, and conclusions through human review and, when needed, domain experts.