
The ChatGPT Data plugin is designed for a specific workflow: start with connected business data, investigate a business question, and turn the analysis into an interactive report or dashboard in ChatGPT Work or Codex. It does not remove source setup requirements or expand permissions: every query remains limited to what the connected account and workspace already allow.
In practice, the safest approach is not to begin with “build a dashboard.” A better sequence is to connect the right source, define the question and metric, verify how the result was produced, and only then build and share the visualization. OpenAI’s documentation specifically recommends checking the source, time period, filters, and metric definition before relying on a result.
What the Data plugin is and what it changes in Work/Codex
The Data plugin packages a data-analysis workflow for ChatGPT Work and Codex. It can use business data and organizational context to investigate changes, explain findings, and create interactive dashboards and reports. You can also refine the analysis through follow-up questions in the same conversation.
This is different from simply attaching a spreadsheet to a chat. Data is intended to work with connected sources and, when available in your environment, corporate metric definitions, BI tools, and other data plugins. Availability still depends on plan, workspace, user role, region, and the capabilities enabled for the account.
Before you start: what needs to be available
- Data plugin: it must be available and installed in your ChatGPT Work or Codex environment.
- Data source: the plugin or app for the source you want to query must also be enabled, configured, and authorized.
- Permissions: the connected account must actually have access to the tables, rows, columns, files, or reports used in the analysis.
- Business context: if your organization maintains a semantic layer, metric documentation, or trusted dashboards, point Data to those definitions to reduce ambiguity.
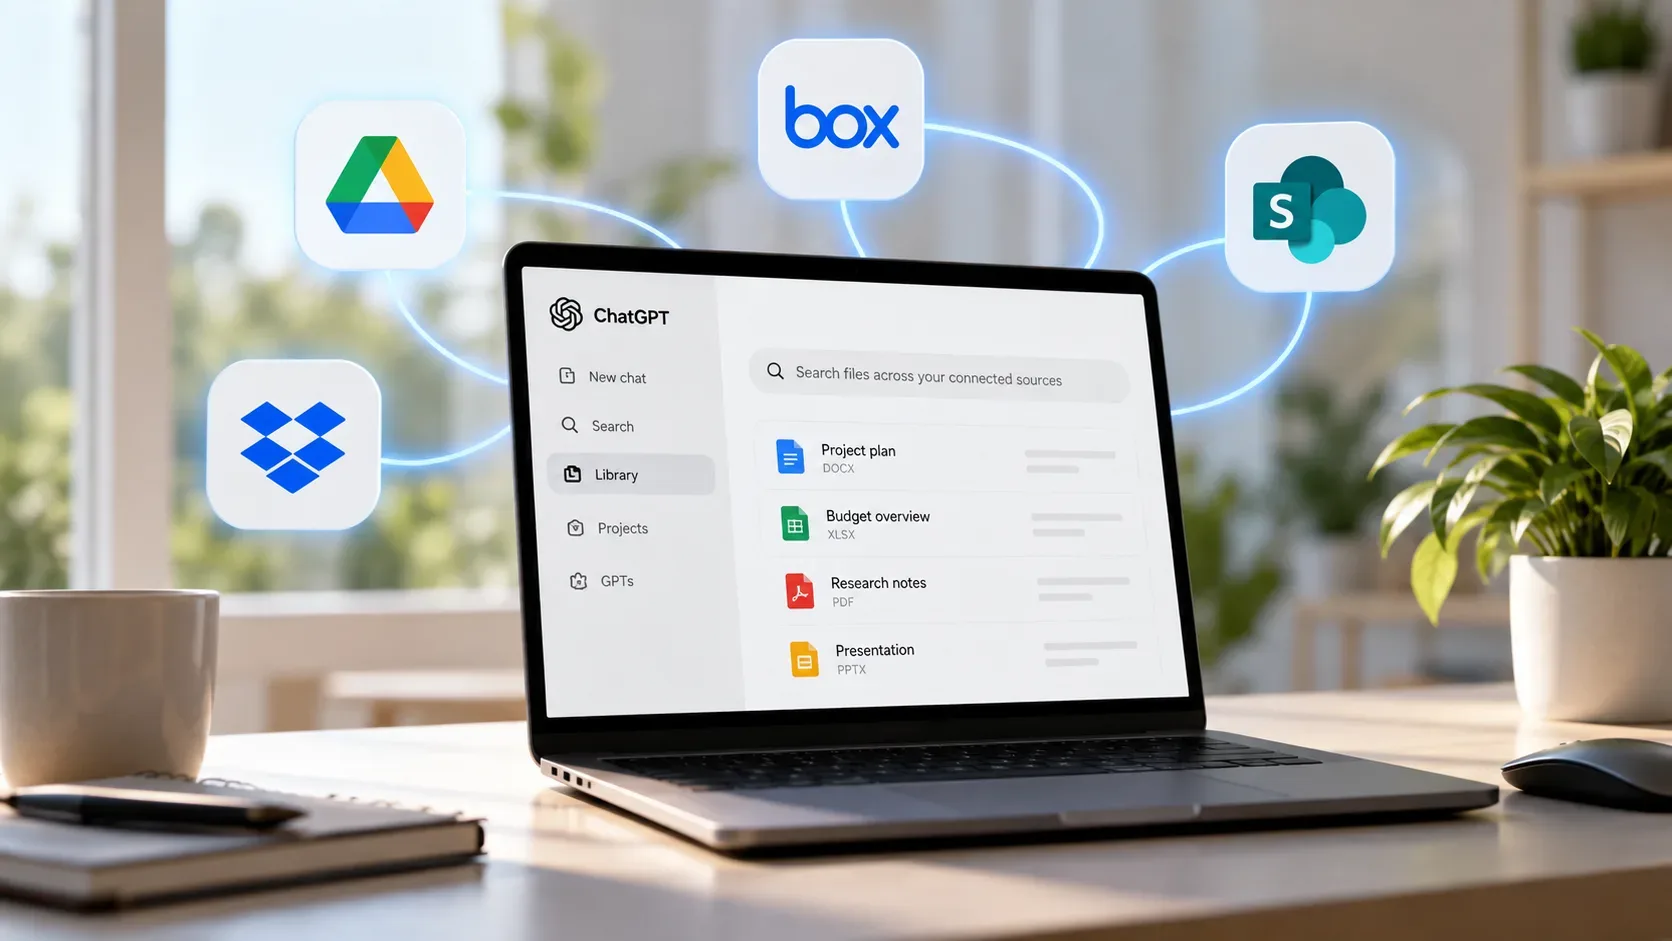
OpenAI lists examples such as Amazon Redshift, ClickHouse, Databricks, Google BigQuery, MongoDB, and Snowflake. Files and documents can also be brought into an analysis from services such as Google Drive and SharePoint when those connections are available. Connected BI tools may include Power BI, Tableau, Sigma, ThoughtSpot, Omni, and Oracle BI, among others.
Step 1: install Data and connect your sources
In ChatGPT, open Plugins — on desktop or in the web plugin directory — find Data, and install it if it is not already available. Then complete any connection steps required by the sources you intend to use.
In managed workspaces, Data installation and access to the underlying apps are separate controls. An administrator can make Data available to a role or group without making a Snowflake, Databricks, or Google Drive connection immediately usable. Some apps still require administrator configuration or provider-account authorization.
Step 2: ask a question with source, metric, period, and comparison
After installation, you can start a conversation with @Data. OpenAI says the plugin can also be triggered implicitly, but recommends using the explicit mention at first while you learn the workflow.
The more specific the request, the easier the result is to validate. Instead of “analyze my sales,” try something like: “Use the orders source, calculate net revenue by region for the current quarter, compare it with the previous quarter, and highlight the three largest changes.”
A strong request identifies four things: which source to use, which metric matters, which time period to analyze, and which comparison answers the business question. If your company has an official definition for “net revenue,” “active customer,” or “retention,” name that definition or ask Data to use the approved semantic layer.
Step 3: validate the analysis before turning it into a dashboard
Data can summarize results quickly, but validation remains part of the job. Before sharing a conclusion, check at least:
- source: which dataset, report, file, or system supported the analysis;
- time period: whether the dates match the requested interval;
- filters: which segments, regions, products, or exclusions were applied;
- metric definition: which rule was used to calculate the indicator;
- comparison: whether the comparison basis matches the business objective;
- permissions: whether missing data could result from the connected account’s access.
If the result differs from an official company dashboard, ask Data to compare the source, filters, time period, and metric definition with that report. This is especially important when custom calculations, transformations, or multiple possible sources exist for the same metric.
Step 4: request the dashboard after validating the numbers
Once the analysis is checked, ask Data to turn it into an interactive dashboard. Describe the metrics, breakdowns, and comparisons you want to see. You can also request changes to charts, layout, and visual guidelines.
A practical prompt could be: “Turn this analysis into a dashboard with total revenue, quarter-over-quarter change, revenue by region, and a table of the largest declines. Keep period and region filters visible and explain the source behind each chart.”
Dashboards can be refined through follow-up questions. You can also ask Data to explain which information supports a chart or refresh the analysis when you need newer data.
Step 5: share and refresh without losing permission controls
If your environment has OpenAI Sites installed, the documentation says a locally generated artifact can be published and shared with people in the workspace. There is an important caveat: the data used in the analysis is copied into the published site. Choose recipients with the sensitivity and permissions of that data in mind.
After publishing, Data can help set up cloud automations to keep a dashboard updated. That does not mean every source or action is automatically supported: available actions depend on the connected app, its capabilities, the account’s permissions, and workspace approval rules.
What changes between ChatGPT Work and Codex
The core Data workflow is the same: analyze connected sources and produce results around a business question. The entry point varies by product surface.
- ChatGPT Work: you can open Plugins and start a conversation with @Data when the plugin is available in the workspace.
- Codex: in a supported task view, OpenAI’s general plugin documentation says to open Sources, choose Use plugins, and select an installed plugin. Available controls can vary by account and workspace.
Do not assume that access to ChatGPT or Codex automatically includes access to Data. OpenAI ties use of the plugin and connected sources to enabled account capabilities, workspace settings, and administrative permissions.
Common problems and how to diagnose them
Data does not appear
Check that you are using the intended account and workspace. In a managed environment, ask an administrator to review Data’s installation policy and access to the required apps.
The connection works, but data is missing
A successful connection does not create new permissions. Verify that the provider account can directly access the dataset, file, or report that should be available. It also helps to name the dataset, report, or metric explicitly in your request.
The dashboard cannot perform an action or shows an unexpected result
Confirm that the connected tool supports the requested action, your account can perform it, and workspace policy allows it. If the analysis looks wrong, return to the underlying sources and definitions before publishing or acting on the result.
A practical lower-risk Data workflow
- Install Data and confirm which sources are actually available.
- Connect only the accounts and apps required for the task.
- Ask a question with explicit source, metric, period, and comparison.
- Request evidence: data origin, filters, and metric definition.
- Compare the result with a trusted reference when one exists.
- Only then turn the analysis into a dashboard or report.
- Review permissions and content before publishing, sharing, or approving actions.
This sequence is more useful than treating Data as an automatic chart generator. Its main advantage is bringing connected sources, business context, iterative analysis, and visualization into one workflow while keeping human review over definitions, evidence, and access.